29
/pt/
pt
AIzaSyAYiBZKx7MnpbEhh9jyipgxe19OcubqV5w
April 1, 2024
46150
Low income
LIC
false
2
1
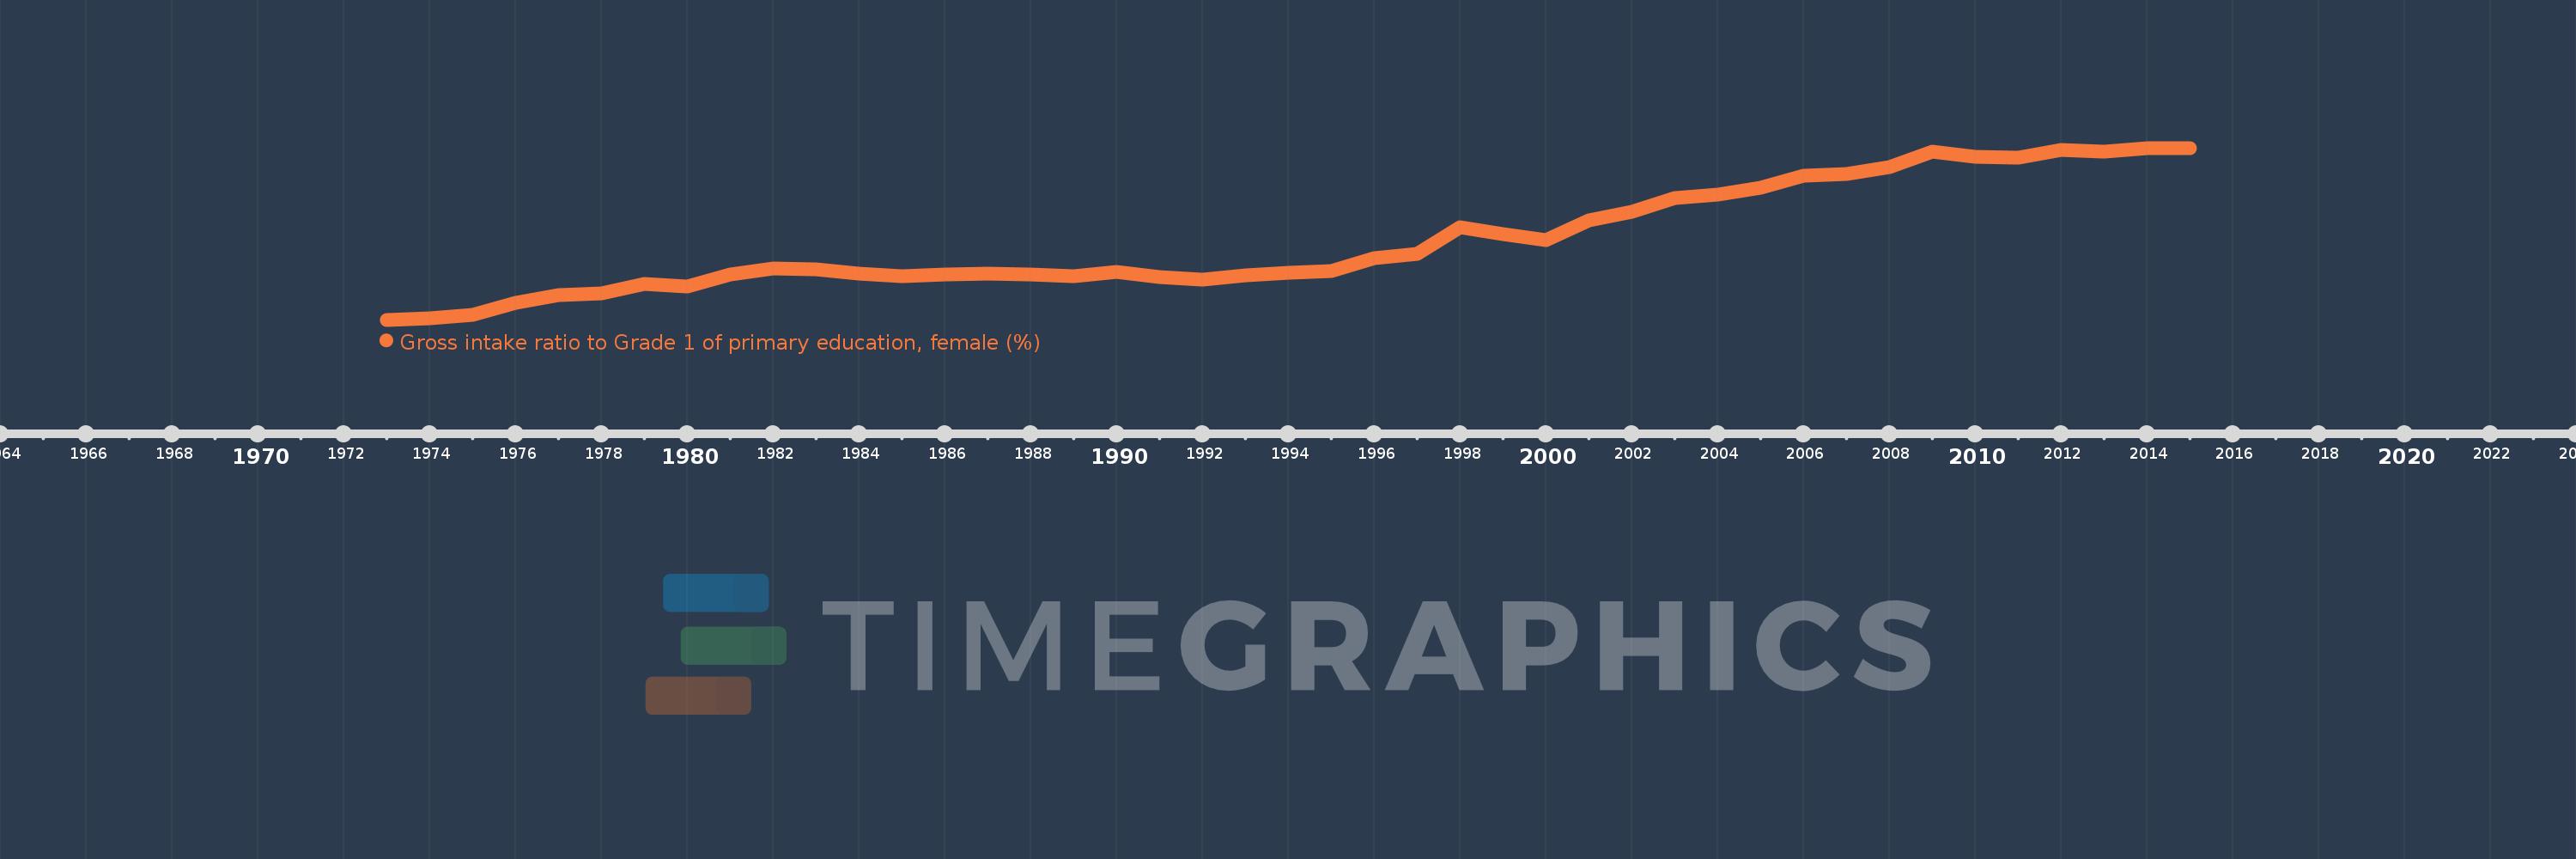
Gross intake ratio to Grade 1 of primary education, female (%)
2015,2014,2013,2012,2011,2010,2009,2008,2007,2006,2005,2004,2003,2002,2001,2000,1999,1998,1997,1996,1995,1994,1993,1992,1991,1990,1989,1988,1987,1986,1985,1984,1983,1982,1981,1980,1979,1978,1977,1976,1975,1974,1973
Estas estatísticas em outros países:
AfghanistanAlbaniaAlgeriaAngolaAntigua and BarbudaArab WorldArgentinaArmeniaArubaAustriaAzerbaijanBahamas, TheBahrainBangladeshBarbadosBelarusBelgiumBelizeBeninBermudaBhutanBoliviaBosnia and HerzegovinaBotswanaBrazilBrunei DarussalamBulgariaBurkina FasoBurundiCabo VerdeCambodiaCameroonCanadaCaribbean small statesCentral African RepublicCentral Europe and the BalticsChadChileChinaColombiaComorosCongo, Dem. Rep.Congo, Rep.Costa RicaCote d'IvoireCroatiaCubaCyprusCzech RepublicDenmarkDjiboutiDominicaDominican RepublicEarly-demographic dividendEast Asia & PacificEast Asia & Pacific (excluding high income)East Asia & Pacific (IDA & IBRD countries)EcuadorEgypt, Arab Rep.El SalvadorEquatorial GuineaEritreaEstoniaEthiopiaEuro areaEurope & Central AsiaEurope & Central Asia (excluding high income)Europe & Central Asia (IDA & IBRD countries)European UnionFijiFinlandFragile and conflict affected situationsFranceGabonGambia, TheGeorgiaGermanyGhanaGreeceGrenadaGuatemalaGuineaGuinea-BissauGuyanaHaitiHeavily indebted poor countries (HIPC)High incomeHondurasHong Kong SAR, ChinaHungaryIBRD onlyIcelandIDA & IBRD totalIDA blendIDA onlyIDA totalIndiaIndonesiaIran, Islamic Rep.IraqIrelandIsraelItalyJamaicaJapanJordanKazakhstanKenyaKiribatiKorea, Dem. People’s Rep.Korea, Rep.KuwaitKyrgyz RepublicLao PDRLate-demographic dividendLatin America & Caribbean Latin America & Caribbean (excluding high income)Latin America & the Caribbean (IDA & IBRD countries)LatviaLeast developed countries: UN classificationLebanonLesothoLiberiaLibyaLiechtensteinLithuaniaLow & middle incomeLow incomeLower middle incomeLuxembourgMacao SAR, ChinaMacedonia, FYRMadagascarMalawiMaldivesMaliMaltaMarshall IslandsMauritaniaMauritiusMexicoMicronesia, Fed. Sts.Middle East & North AfricaMiddle East & North Africa (excluding high income)Middle East & North Africa (IDA & IBRD countries)Middle incomeMoldovaMongoliaMontenegroMoroccoMozambiqueMyanmarNamibiaNauruNepalNetherlandsNew ZealandNicaraguaNigerNigeriaNorth AmericaNorwayOECD membersOmanOther small statesPacific island small statesPakistanPalauPanamaPapua New GuineaParaguayPeruPhilippinesPolandPortugalPost-demographic dividendPre-demographic dividendPuerto RicoQatarRomaniaRussian FederationRwandaSamoaSan MarinoSao Tome and PrincipeSaudi ArabiaSenegalSerbiaSeychellesSierra LeoneSlovak RepublicSloveniaSmall statesSolomon IslandsSouth AfricaSouth AsiaSouth Asia (IDA & IBRD)South SudanSpainSri LankaSt. Kitts and NevisSt. LuciaSt. Vincent and the GrenadinesSub-Saharan Africa Sub-Saharan Africa (excluding high income)Sub-Saharan Africa (IDA & IBRD countries)SudanSurinameSwazilandSwedenSwitzerlandSyrian Arab RepublicTajikistanTanzaniaThailandTimor-LesteTogoTongaTrinidad and TobagoTunisiaTurkeyTuvaluUgandaUkraineUnited Arab EmiratesUnited StatesUpper middle incomeUruguayUzbekistanVanuatuVenezuela, RBVietnamWest Bank and GazaWorldYemen, Rep.ZambiaZimbabwe Linha do tempo:
Nesta escala de tempo está apresentado um gráfico de 1973 ano até 2015 ano Low income. Dados de 1972 ano ausente. O número de observações reais por data: 43.
Fonte (nome):
Indicadores de desenvolvimento mundial
Fonte (organização):
UNESCO Institute for Statistics
Categorias:
Education, Gender
Foi atualizado:
23 abr 2017 ano
Indicadores de alterações dos valores ao longo dos anos
Mínimo:
47.086
1 jan 1973 ano
Máximo:
123.188
1 jan 2015 ano
Na data de observação
Valor
Mudança absoluta
A alteração em relação ao valor anterior
1 jan 1973 ano
47.086
+47.086
0.0%
1 jan 1974 ano
47.651
+0.565
1.2%
1 jan 1975 ano
49.145
+1.493
3.13%
1 jan 1976 ano
54.494
+5.349
10.89%
1 jan 1977 ano
57.965
+3.471
6.37%
1 jan 1978 ano
58.949
+0.983
1.7%
1 jan 1979 ano
63.083
+4.135
7.01%
1 jan 1980 ano
61.759
-1.324
-2.1%
1 jan 1981 ano
67.023
+5.264
8.52%
1 jan 1982 ano
69.786
+2.763
4.12%
1 jan 1983 ano
69.416
-0.371
-0.53%
1 jan 1984 ano
67.624
-1.791
-2.58%
1 jan 1985 ano
66.454
-1.171
-1.73%
1 jan 1986 ano
67.05
+0.596
0.9%
1 jan 1987 ano
67.47
+0.42
0.63%
1 jan 1988 ano
67.161
-0.308
-0.46%
1 jan 1989 ano
66.244
-0.917
-1.37%
1 jan 1990 ano
68.119
+1.875
2.83%
1 jan 1991 ano
65.823
-2.296
-3.37%
1 jan 1992 ano
64.818
-1.004
-1.53%
1 jan 1993 ano
66.69
+1.872
2.89%
1 jan 1994 ano
67.886
+1.195
1.79%
1 jan 1995 ano
68.531
+0.645
0.95%
1 jan 1996 ano
74.418
+5.887
8.59%
1 jan 1997 ano
76.093
+1.674
2.25%
1 jan 1998 ano
88.248
+12.155
15.97%
1 jan 1999 ano
85.086
-3.162
-3.58%
1 jan 2000 ano
82.399
-2.687
-3.16%
1 jan 2001 ano
91.098
+8.7
10.56%
1 jan 2002 ano
94.812
+3.713
4.08%
1 jan 2003 ano
100.995
+6.184
6.52%
1 jan 2004 ano
102.595
+1.6
1.58%
1 jan 2005 ano
105.692
+3.097
3.02%
1 jan 2006 ano
110.763
+5.072
4.8%
1 jan 2007 ano
111.61
+0.847
0.76%
1 jan 2008 ano
114.585
+2.975
2.67%
1 jan 2009 ano
121.494
+6.908
6.03%
1 jan 2010 ano
119.128
-2.365
-1.95%
1 jan 2011 ano
118.743
-0.385
-0.32%
1 jan 2012 ano
122.373
+3.629
3.06%
1 jan 2013 ano
121.694
-0.679
-0.55%
1 jan 2014 ano
122.991
+1.298
1.07%
1 jan 2015 ano
123.188
+0.197
0.16%
Classificação de países por estatísticas atuais por anos


Comentários: