30
/pt/
AIzaSyAYiBZKx7MnpbEhh9jyipgxe19OcubqV5w
April 1, 2024
148004
Guyana
GUY
true
2
1
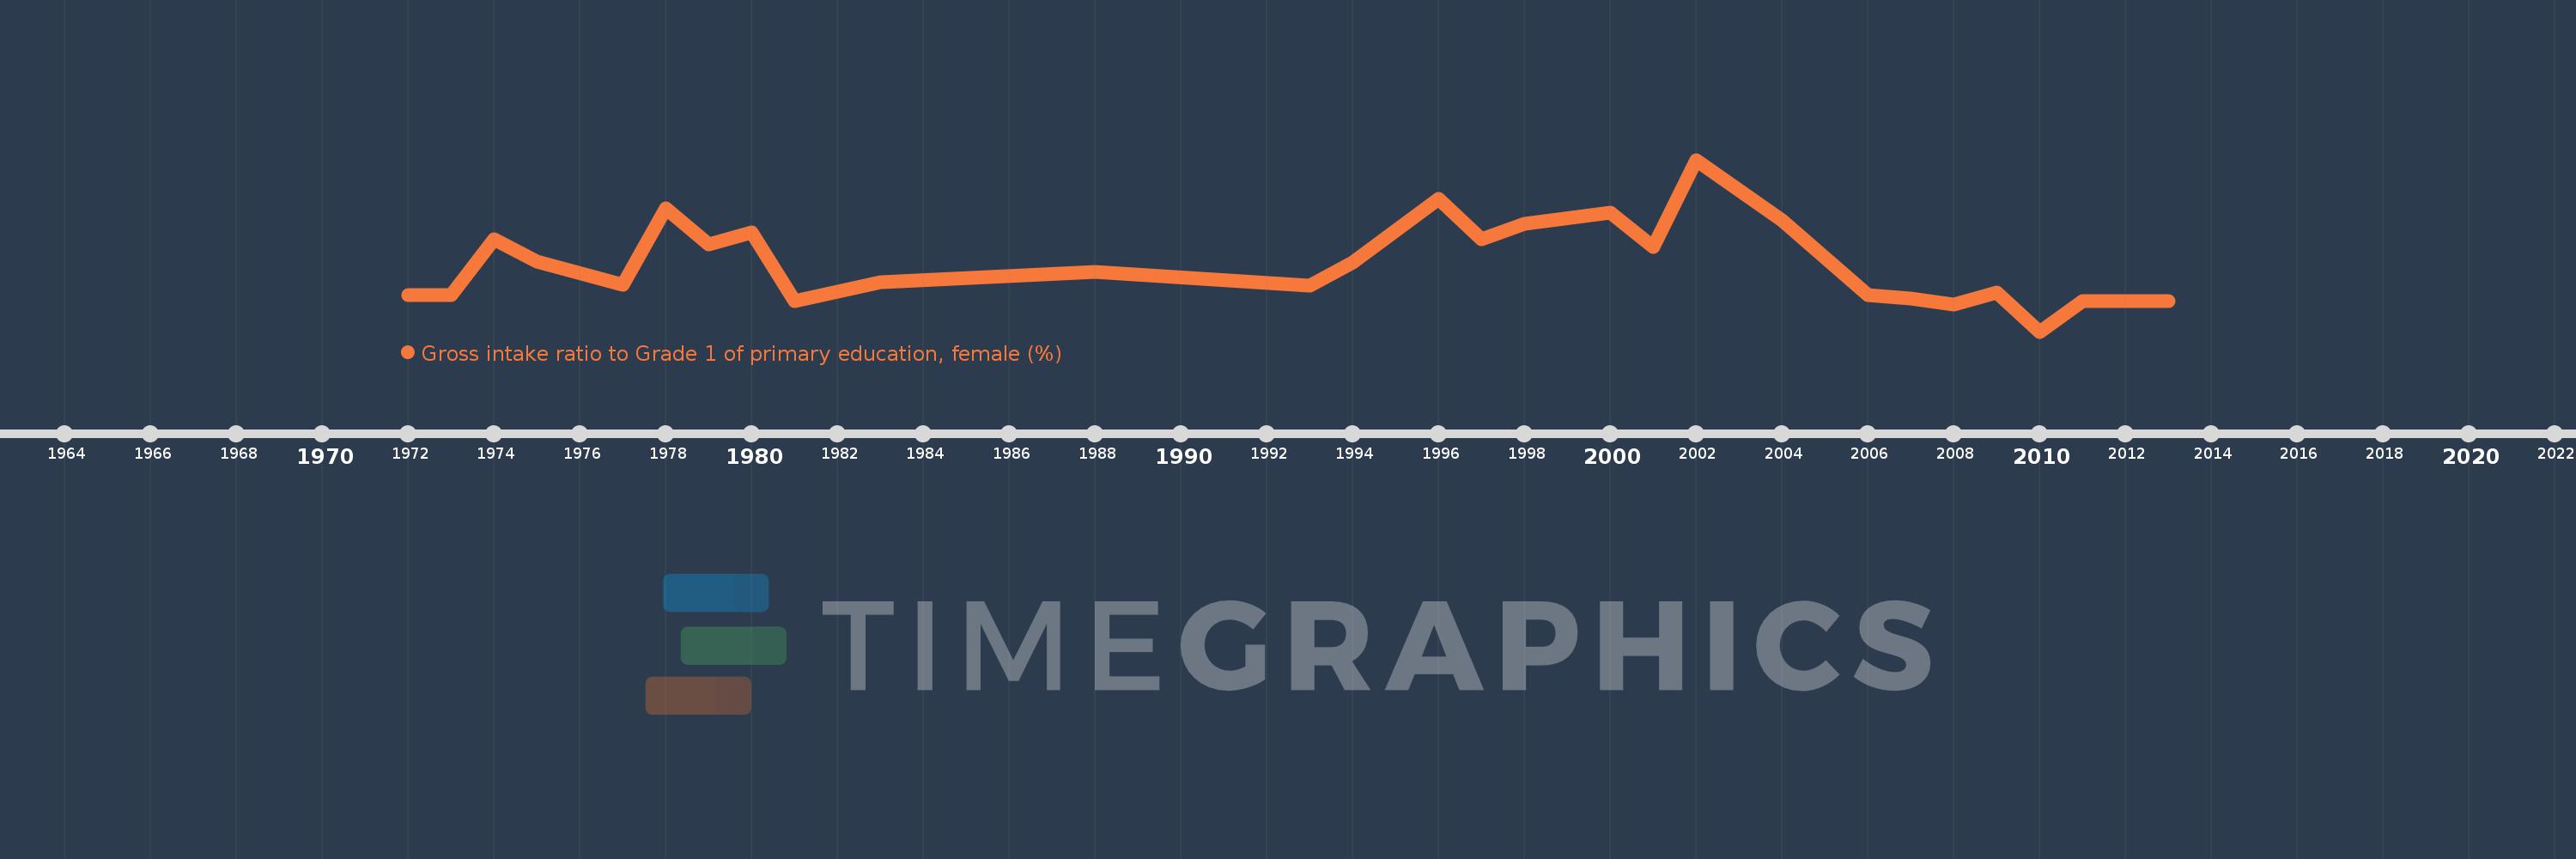
Gross intake ratio to Grade 1 of primary education, female (%)
2013,2012,2011,2010,2009,2008,2007,2006,2004,2002,2001,2000,1998,1997,1996,1994,1993,1988,1983,1981,1980,1979,1978,1977,1975,1974,1973,1972
