29
/pt/
pt
AIzaSyAYiBZKx7MnpbEhh9jyipgxe19OcubqV5w
April 1, 2024
45824
Low income
LIC
false
2
1
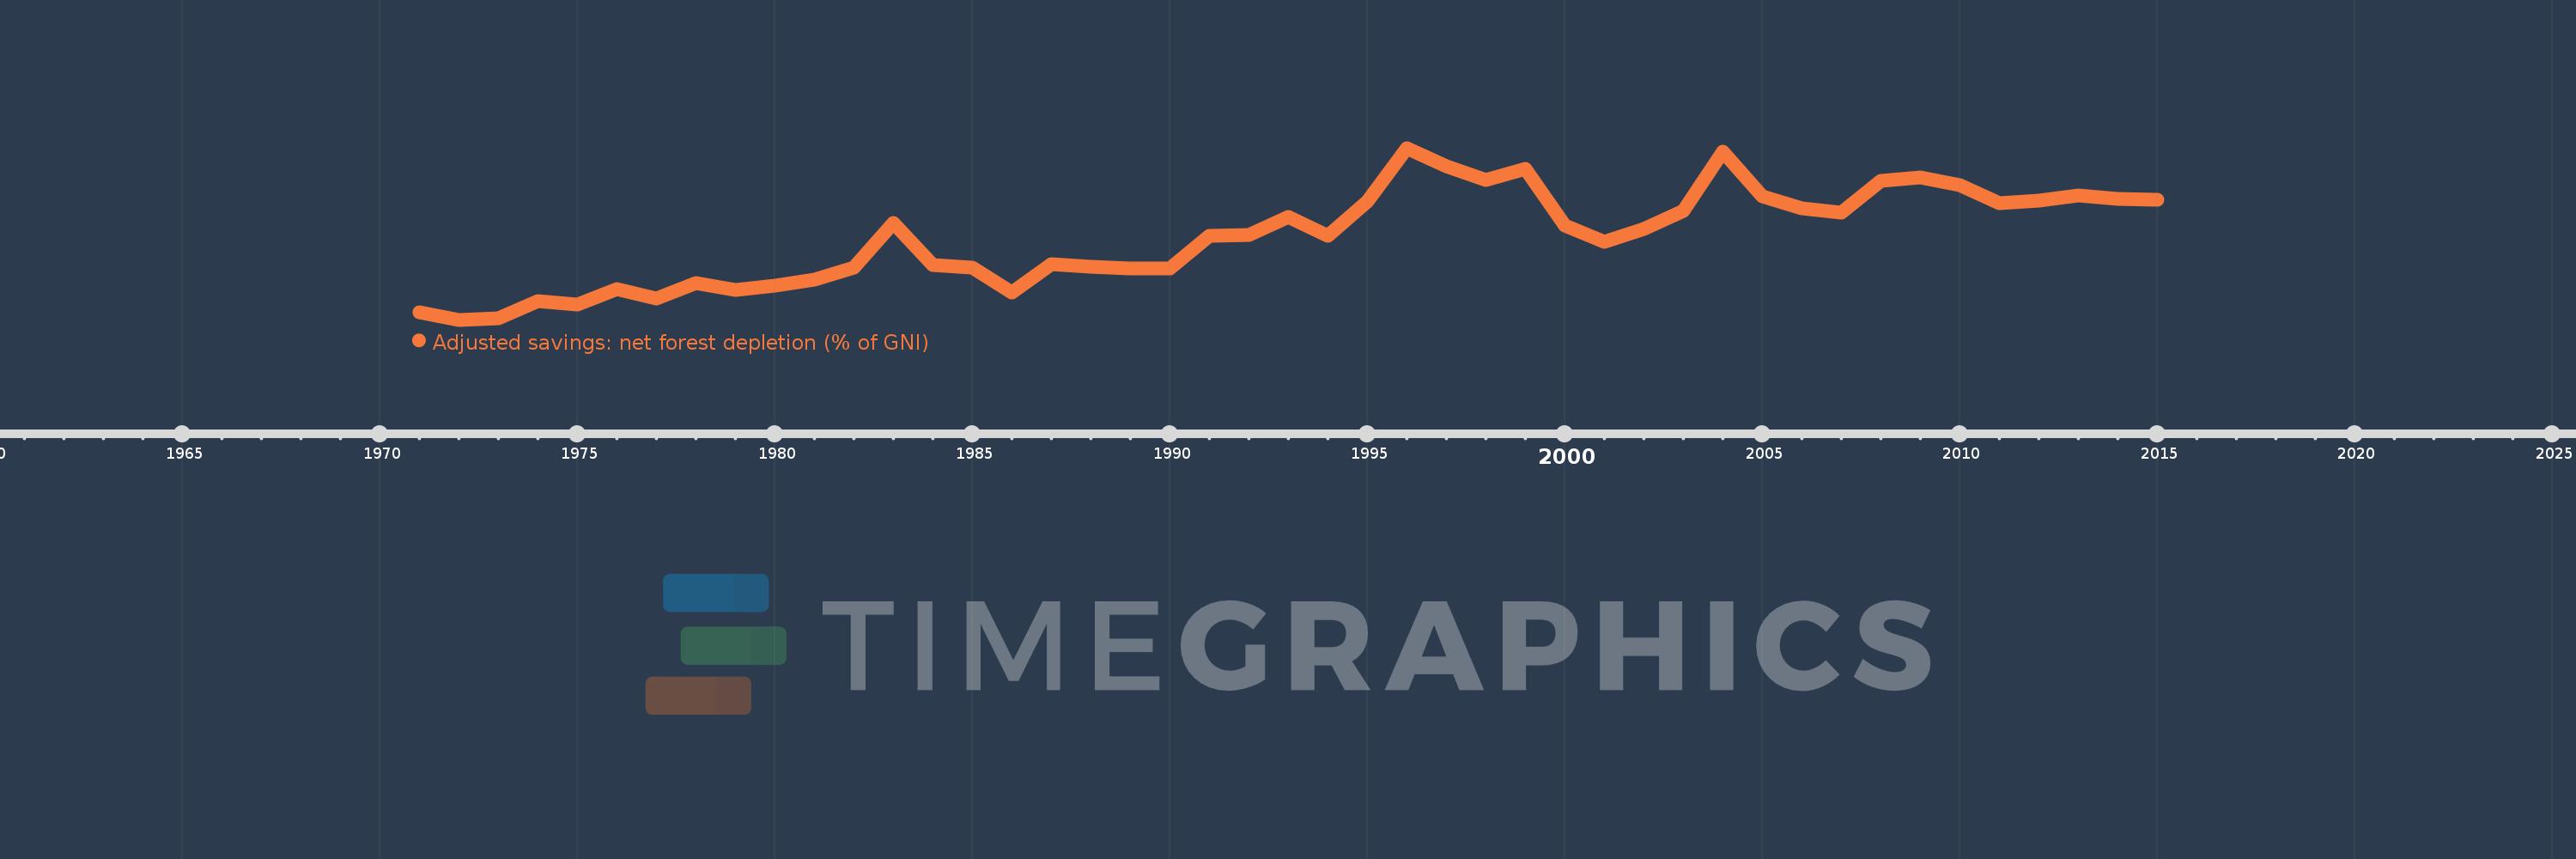
Adjusted savings: net forest depletion (% of GNI)
2015,2014,2013,2012,2011,2010,2009,2008,2007,2006,2005,2004,2003,2002,2001,2000,1999,1998,1997,1996,1995,1994,1993,1992,1991,1990,1989,1988,1987,1986,1985,1984,1983,1982,1981,1980,1979,1978,1977,1976,1975,1974,1973,1972,1971
Estas estatísticas em outros países:
AfghanistanAlbaniaAlgeriaAngolaArab WorldArgentinaArmeniaAustraliaAustriaAzerbaijanBahamas, TheBahrainBangladeshBarbadosBelarusBelgiumBelizeBeninBhutanBoliviaBotswanaBrazilBrunei DarussalamBulgariaBurkina FasoBurundiCabo VerdeCambodiaCameroonCanadaCaribbean small statesCentral African RepublicCentral Europe and the BalticsChadChileChinaColombiaComorosCongo, Dem. Rep.Congo, Rep.Costa RicaCote d'IvoireCroatiaCubaCyprusCzech RepublicDenmarkDjiboutiDominicaDominican RepublicEarly-demographic dividendEast Asia & PacificEast Asia & Pacific (excluding high income)East Asia & Pacific (IDA & IBRD countries)EcuadorEgypt, Arab Rep.El SalvadorEquatorial GuineaEritreaEstoniaEthiopiaEuro areaEurope & Central AsiaEurope & Central Asia (excluding high income)Europe & Central Asia (IDA & IBRD countries)European UnionFijiFinlandFragile and conflict affected situationsFranceFrench PolynesiaGabonGambia, TheGeorgiaGermanyGhanaGreeceGuatemalaGuineaGuinea-BissauGuyanaHaitiHeavily indebted poor countries (HIPC)High incomeHondurasHong Kong SAR, ChinaHungaryIBRD onlyIcelandIDA & IBRD totalIDA blendIDA onlyIDA totalIndiaIndonesiaIran, Islamic Rep.IraqIrelandIsraelItalyJamaicaJapanJordanKazakhstanKenyaKiribatiKorea, Rep.KuwaitKyrgyz RepublicLao PDRLate-demographic dividendLatin America & Caribbean Latin America & Caribbean (excluding high income)Latin America & the Caribbean (IDA & IBRD countries)LatviaLeast developed countries: UN classificationLebanonLesothoLiberiaLibyaLithuaniaLow & middle incomeLow incomeLower middle incomeLuxembourgMacedonia, FYRMadagascarMalawiMalaysiaMaldivesMaliMauritaniaMauritiusMexicoMicronesia, Fed. Sts.Middle East & North AfricaMiddle East & North Africa (excluding high income)Middle East & North Africa (IDA & IBRD countries)Middle incomeMoldovaMongoliaMoroccoMozambiqueMyanmarNamibiaNepalNetherlandsNew CaledoniaNew ZealandNicaraguaNigerNigeriaNorth AmericaNorwayOECD membersOmanOther small statesPacific island small statesPakistanPanamaPapua New GuineaParaguayPeruPhilippinesPolandPortugalPost-demographic dividendPre-demographic dividendQatarRomaniaRussian FederationRwandaSamoaSao Tome and PrincipeSaudi ArabiaSenegalSeychellesSierra LeoneSingaporeSlovak RepublicSloveniaSmall statesSolomon IslandsSomaliaSouth AfricaSouth AsiaSouth Asia (IDA & IBRD)SpainSri LankaSt. LuciaSt. Vincent and the GrenadinesSub-Saharan Africa Sub-Saharan Africa (excluding high income)Sub-Saharan Africa (IDA & IBRD countries)SudanSurinameSwazilandSwedenSwitzerlandSyrian Arab RepublicTajikistanTanzaniaThailandTogoTongaTrinidad and TobagoTunisiaTurkeyTurkmenistanUgandaUkraineUnited Arab EmiratesUnited KingdomUnited StatesUpper middle incomeUruguayUzbekistanVanuatuVenezuela, RBVietnamWorldYemen, Rep.ZambiaZimbabwe Linha do tempo:
Nesta escala de tempo está apresentado um gráfico de 1971 ano até 2015 ano Low income. Dados de 1970 ano ausente. O número de observações reais por data: 45.
Fonte (nome):
Indicadores de desenvolvimento mundial
Fonte (organização):
World Bank staff estimates based on sources and methods in World Bank's "The Changing Wealth of Nations: Measuring Sustainable Development in the New Millennium" (2011).
Categorias:
Economy & Growth, Environment
Foi atualizado:
23 abr 2017 ano
Indicadores de alterações dos valores ao longo dos anos
Mínimo:
1.149
1 jan 1972 ano
Máximo:
7.983
1 jan 1996 ano
Na data de observação
Valor
Mudança absoluta
A alteração em relação ao valor anterior
1 jan 1971 ano
1.442
+1.442
0.0%
1 jan 1972 ano
1.149
-0.293
-20.31%
1 jan 1973 ano
1.2
+0.051
4.42%
1 jan 1974 ano
1.88
+0.68
56.7%
1 jan 1975 ano
1.74
-0.141
-7.48%
1 jan 1976 ano
2.382
+0.642
36.92%
1 jan 1977 ano
1.984
-0.398
-16.69%
1 jan 1978 ano
2.61
+0.626
31.54%
1 jan 1979 ano
2.32
-0.29
-11.13%
1 jan 1980 ano
2.489
+0.169
7.3%
1 jan 1981 ano
2.736
+0.247
9.94%
1 jan 1982 ano
3.225
+0.489
17.87%
1 jan 1983 ano
4.993
+1.767
54.8%
1 jan 1984 ano
3.315
-1.678
-33.61%
1 jan 1985 ano
3.227
-0.087
-2.63%
1 jan 1986 ano
2.228
-0.999
-30.96%
1 jan 1987 ano
3.367
+1.138
51.08%
1 jan 1988 ano
3.253
-0.113
-3.36%
1 jan 1989 ano
3.199
-0.054
-1.67%
1 jan 1990 ano
3.18
-0.019
-0.59%
1 jan 1991 ano
4.477
+1.297
40.79%
1 jan 1992 ano
4.523
+0.046
1.02%
1 jan 1993 ano
5.233
+0.71
15.71%
1 jan 1994 ano
4.471
-0.762
-14.56%
1 jan 1995 ano
5.868
+1.397
31.25%
1 jan 1996 ano
7.983
+2.115
36.04%
1 jan 1997 ano
7.264
-0.72
-9.01%
1 jan 1998 ano
6.711
-0.553
-7.61%
1 jan 1999 ano
7.164
+0.453
6.75%
1 jan 2000 ano
4.887
-2.277
-31.78%
1 jan 2001 ano
4.233
-0.654
-13.39%
1 jan 2002 ano
4.755
+0.522
12.34%
1 jan 2003 ano
5.467
+0.712
14.97%
1 jan 2004 ano
7.843
+2.376
43.45%
1 jan 2005 ano
6.053
-1.789
-22.81%
1 jan 2006 ano
5.597
-0.457
-7.55%
1 jan 2007 ano
5.403
-0.193
-3.46%
1 jan 2008 ano
6.666
+1.262
23.36%
1 jan 2009 ano
6.802
+0.137
2.05%
1 jan 2010 ano
6.493
-0.309
-4.55%
1 jan 2011 ano
5.802
-0.69
-10.63%
1 jan 2012 ano
5.887
+0.084
1.46%
1 jan 2013 ano
6.092
+0.205
3.48%
1 jan 2014 ano
5.946
-0.146
-2.39%
1 jan 2015 ano
5.912
-0.034
-0.57%
Classificação de países por estatísticas atuais por anos


Comentários: