29
/pt/
pt
AIzaSyAYiBZKx7MnpbEhh9jyipgxe19OcubqV5w
April 1, 2024
44027
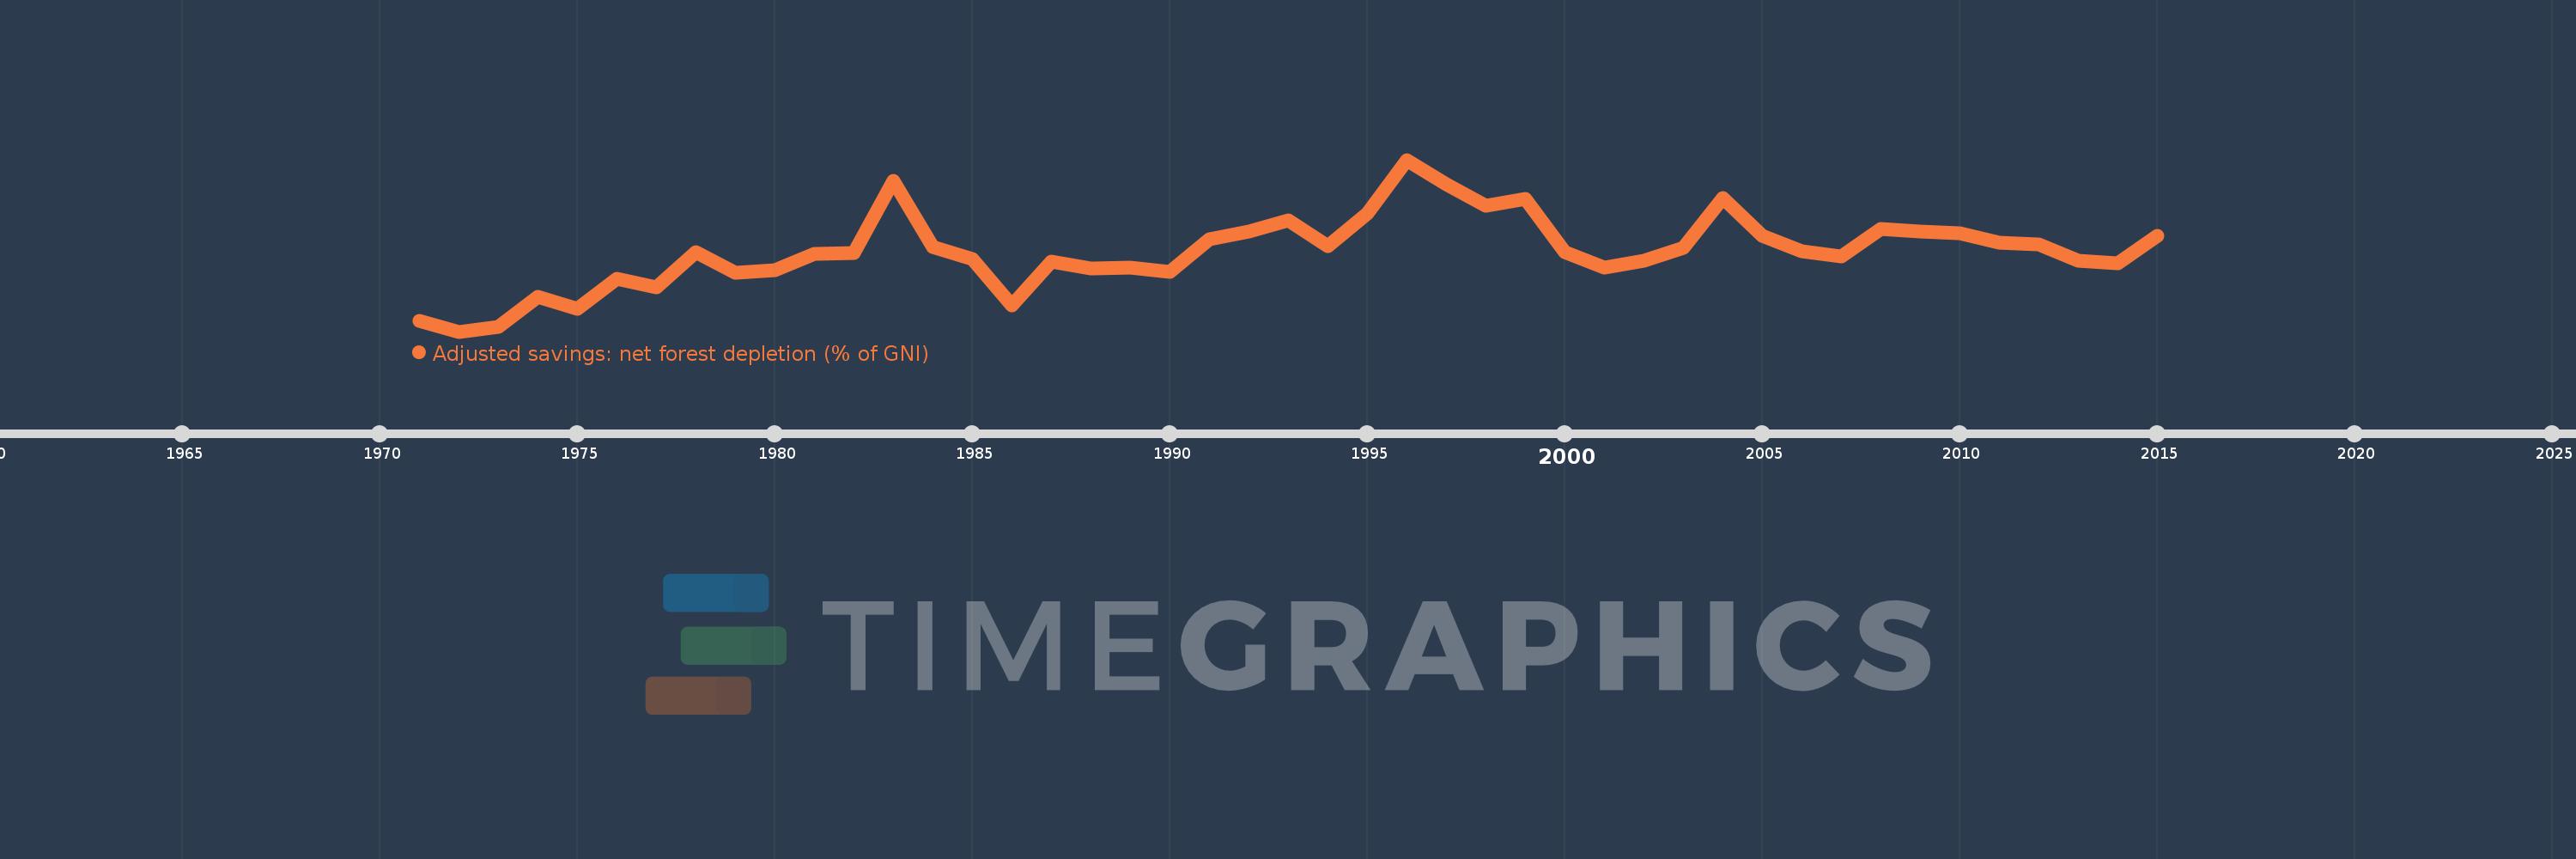
Least developed countries: UN classification
LDC
false
2
1
Adjusted savings: net forest depletion (% of GNI)
2015,2014,2013,2012,2011,2010,2009,2008,2007,2006,2005,2004,2003,2002,2001,2000,1999,1998,1997,1996,1995,1994,1993,1992,1991,1990,1989,1988,1987,1986,1985,1984,1983,1982,1981,1980,1979,1978,1977,1976,1975,1974,1973,1972,1971
Estas estatísticas em outros países:
AfghanistanAlbaniaAlgeriaAngolaArab WorldArgentinaArmeniaAustraliaAustriaAzerbaijanBahamas, TheBahrainBangladeshBarbadosBelarusBelgiumBelizeBeninBhutanBoliviaBotswanaBrazilBrunei DarussalamBulgariaBurkina FasoBurundiCabo VerdeCambodiaCameroonCanadaCaribbean small statesCentral African RepublicCentral Europe and the BalticsChadChileChinaColombiaComorosCongo, Dem. Rep.Congo, Rep.Costa RicaCote d'IvoireCroatiaCubaCyprusCzech RepublicDenmarkDjiboutiDominicaDominican RepublicEarly-demographic dividendEast Asia & PacificEast Asia & Pacific (excluding high income)East Asia & Pacific (IDA & IBRD countries)EcuadorEgypt, Arab Rep.El SalvadorEquatorial GuineaEritreaEstoniaEthiopiaEuro areaEurope & Central AsiaEurope & Central Asia (excluding high income)Europe & Central Asia (IDA & IBRD countries)European UnionFijiFinlandFragile and conflict affected situationsFranceFrench PolynesiaGabonGambia, TheGeorgiaGermanyGhanaGreeceGuatemalaGuineaGuinea-BissauGuyanaHaitiHeavily indebted poor countries (HIPC)High incomeHondurasHong Kong SAR, ChinaHungaryIBRD onlyIcelandIDA & IBRD totalIDA blendIDA onlyIDA totalIndiaIndonesiaIran, Islamic Rep.IraqIrelandIsraelItalyJamaicaJapanJordanKazakhstanKenyaKiribatiKorea, Rep.KuwaitKyrgyz RepublicLao PDRLate-demographic dividendLatin America & Caribbean Latin America & Caribbean (excluding high income)Latin America & the Caribbean (IDA & IBRD countries)LatviaLeast developed countries: UN classificationLebanonLesothoLiberiaLibyaLithuaniaLow & middle incomeLow incomeLower middle incomeLuxembourgMacedonia, FYRMadagascarMalawiMalaysiaMaldivesMaliMauritaniaMauritiusMexicoMicronesia, Fed. Sts.Middle East & North AfricaMiddle East & North Africa (excluding high income)Middle East & North Africa (IDA & IBRD countries)Middle incomeMoldovaMongoliaMoroccoMozambiqueMyanmarNamibiaNepalNetherlandsNew CaledoniaNew ZealandNicaraguaNigerNigeriaNorth AmericaNorwayOECD membersOmanOther small statesPacific island small statesPakistanPanamaPapua New GuineaParaguayPeruPhilippinesPolandPortugalPost-demographic dividendPre-demographic dividendQatarRomaniaRussian FederationRwandaSamoaSao Tome and PrincipeSaudi ArabiaSenegalSeychellesSierra LeoneSingaporeSlovak RepublicSloveniaSmall statesSolomon IslandsSomaliaSouth AfricaSouth AsiaSouth Asia (IDA & IBRD)SpainSri LankaSt. LuciaSt. Vincent and the GrenadinesSub-Saharan Africa Sub-Saharan Africa (excluding high income)Sub-Saharan Africa (IDA & IBRD countries)SudanSurinameSwazilandSwedenSwitzerlandSyrian Arab RepublicTajikistanTanzaniaThailandTogoTongaTrinidad and TobagoTunisiaTurkeyTurkmenistanUgandaUkraineUnited Arab EmiratesUnited KingdomUnited StatesUpper middle incomeUruguayUzbekistanVanuatuVenezuela, RBVietnamWorldYemen, Rep.ZambiaZimbabwe Linha do tempo:
Nesta escala de tempo está apresentado um gráfico de 1971 ano até 2015 ano Least developed countries: UN classification. Dados de 1970 ano ausente. O número de observações reais por data: 45.
Fonte (nome):
Indicadores de desenvolvimento mundial
Fonte (organização):
World Bank staff estimates based on sources and methods in World Bank's "The Changing Wealth of Nations: Measuring Sustainable Development in the New Millennium" (2011).
Categorias:
Economy & Growth, Environment
Foi atualizado:
23 abr 2017 ano
Indicadores de alterações dos valores ao longo dos anos
Mínimo:
1.166
1 jan 1972 ano
Máximo:
5.525
1 jan 1996 ano
Na data de observação
Valor
Mudança absoluta
A alteração em relação ao valor anterior
1 jan 1971 ano
1.435
+1.435
0.0%
1 jan 1972 ano
1.166
-0.269
-18.74%
1 jan 1973 ano
1.294
+0.128
10.98%
1 jan 1974 ano
2.049
+0.755
58.31%
1 jan 1975 ano
1.736
-0.313
-15.27%
1 jan 1976 ano
2.514
+0.779
44.85%
1 jan 1977 ano
2.29
-0.224
-8.92%
1 jan 1978 ano
3.181
+0.891
38.91%
1 jan 1979 ano
2.659
-0.522
-16.41%
1 jan 1980 ano
2.714
+0.055
2.06%
1 jan 1981 ano
3.136
+0.422
15.54%
1 jan 1982 ano
3.157
+0.021
0.67%
1 jan 1983 ano
4.993
+1.836
58.15%
1 jan 1984 ano
3.311
-1.682
-33.68%
1 jan 1985 ano
3.005
-0.307
-9.26%
1 jan 1986 ano
1.822
-1.182
-39.35%
1 jan 1987 ano
2.933
+1.111
60.96%
1 jan 1988 ano
2.772
-0.161
-5.48%
1 jan 1989 ano
2.781
+0.008
0.3%
1 jan 1990 ano
2.675
-0.105
-3.79%
1 jan 1991 ano
3.504
+0.828
30.96%
1 jan 1992 ano
3.713
+0.209
5.96%
1 jan 1993 ano
3.989
+0.276
7.45%
1 jan 1994 ano
3.341
-0.648
-16.25%
1 jan 1995 ano
4.159
+0.818
24.5%
1 jan 1996 ano
5.525
+1.365
32.83%
1 jan 1997 ano
4.902
-0.623
-11.27%
1 jan 1998 ano
4.358
-0.544
-11.1%
1 jan 1999 ano
4.543
+0.186
4.26%
1 jan 2000 ano
3.181
-1.363
-29.99%
1 jan 2001 ano
2.782
-0.399
-12.54%
1 jan 2002 ano
2.966
+0.184
6.62%
1 jan 2003 ano
3.299
+0.333
11.24%
1 jan 2004 ano
4.561
+1.261
38.23%
1 jan 2005 ano
3.589
-0.972
-21.3%
1 jan 2006 ano
3.214
-0.376
-10.46%
1 jan 2007 ano
3.066
-0.147
-4.58%
1 jan 2008 ano
3.78
+0.713
23.26%
1 jan 2009 ano
3.71
-0.07
-1.85%
1 jan 2010 ano
3.653
-0.057
-1.54%
1 jan 2011 ano
3.418
-0.234
-6.42%
1 jan 2012 ano
3.388
-0.03
-0.88%
1 jan 2013 ano
2.969
-0.419
-12.37%
1 jan 2014 ano
2.899
-0.07
-2.35%
1 jan 2015 ano
3.594
+0.695
23.97%
Classificação de países por estatísticas atuais por anos


Comentários: