29
/pt/
pt
AIzaSyAYiBZKx7MnpbEhh9jyipgxe19OcubqV5w
April 1, 2024
43868
Latin America & the Caribbean (IDA & IBRD countries)
TLA
false
2
1
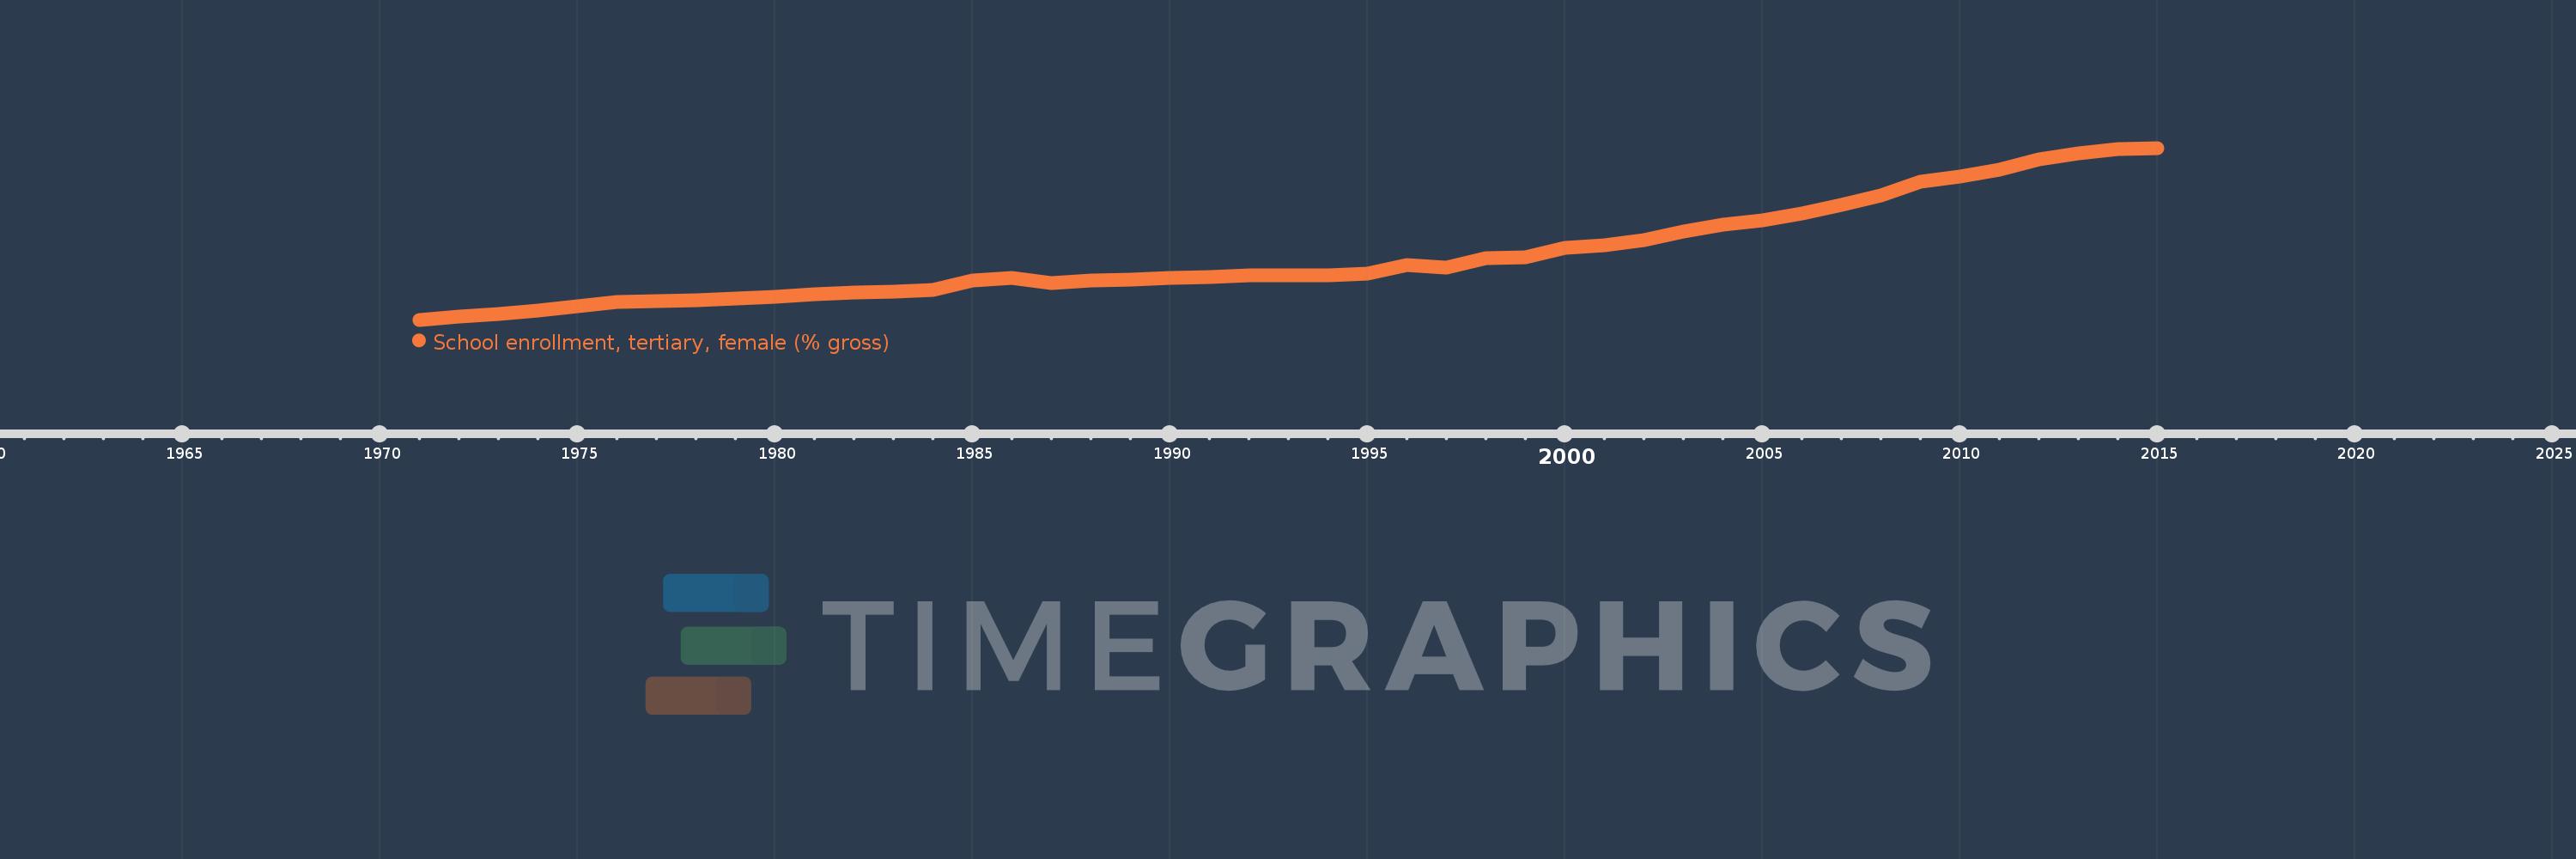
School enrollment, tertiary, female (% gross)
2015,2014,2013,2012,2011,2010,2009,2008,2007,2006,2005,2004,2003,2002,2001,2000,1999,1998,1997,1996,1995,1994,1993,1992,1991,1990,1989,1988,1987,1986,1985,1984,1983,1982,1981,1980,1979,1978,1977,1976,1975,1974,1973,1972,1971
Estas estatísticas em outros países:
AfghanistanAlbaniaAlgeriaAngolaAntigua and BarbudaArab WorldArgentinaArmeniaArubaAustraliaAustriaAzerbaijanBahamas, TheBahrainBangladeshBarbadosBelarusBelgiumBelizeBeninBermudaBhutanBoliviaBosnia and HerzegovinaBotswanaBrazilBrunei DarussalamBulgariaBurkina FasoBurundiCabo VerdeCambodiaCameroonCanadaCaribbean small statesCentral African RepublicCentral Europe and the BalticsChadChileChinaColombiaComorosCongo, Dem. Rep.Congo, Rep.Costa RicaCote d'IvoireCroatiaCubaCuracaoCyprusCzech RepublicDenmarkDjiboutiDominicaDominican RepublicEarly-demographic dividendEast Asia & PacificEast Asia & Pacific (excluding high income)East Asia & Pacific (IDA & IBRD countries)EcuadorEgypt, Arab Rep.El SalvadorEquatorial GuineaEritreaEstoniaEthiopiaEuro areaEurope & Central AsiaEurope & Central Asia (excluding high income)Europe & Central Asia (IDA & IBRD countries)European UnionFijiFinlandFragile and conflict affected situationsFranceGabonGambia, TheGeorgiaGermanyGhanaGreeceGrenadaGuatemalaGuineaGuinea-BissauGuyanaHaitiHeavily indebted poor countries (HIPC)High incomeHondurasHong Kong SAR, ChinaHungaryIBRD onlyIcelandIDA & IBRD totalIDA blendIDA onlyIDA totalIndiaIndonesiaIran, Islamic Rep.IraqIrelandIsraelItalyJamaicaJapanJordanKazakhstanKenyaKorea, Dem. People’s Rep.Korea, Rep.KuwaitKyrgyz RepublicLao PDRLate-demographic dividendLatin America & Caribbean Latin America & Caribbean (excluding high income)Latin America & the Caribbean (IDA & IBRD countries)LatviaLeast developed countries: UN classificationLebanonLesothoLiberiaLibyaLiechtensteinLithuaniaLow & middle incomeLow incomeLower middle incomeLuxembourgMacao SAR, ChinaMacedonia, FYRMadagascarMalawiMaldivesMaliMaltaMarshall IslandsMauritaniaMauritiusMexicoMicronesia, Fed. Sts.Middle East & North AfricaMiddle East & North Africa (excluding high income)Middle East & North Africa (IDA & IBRD countries)Middle incomeMoldovaMongoliaMontenegroMoroccoMozambiqueMyanmarNamibiaNepalNetherlandsNew ZealandNicaraguaNigerNigeriaNorth AmericaNorwayOECD membersOmanOther small statesPacific island small statesPakistanPalauPanamaPapua New GuineaParaguayPeruPhilippinesPolandPortugalPost-demographic dividendPre-demographic dividendPuerto RicoQatarRomaniaRussian FederationRwandaSamoaSan MarinoSao Tome and PrincipeSaudi ArabiaSenegalSerbiaSeychellesSierra LeoneSingaporeSlovak RepublicSloveniaSmall statesSomaliaSouth AfricaSouth AsiaSouth Asia (IDA & IBRD)SpainSri LankaSt. Kitts and NevisSt. LuciaSt. Vincent and the GrenadinesSub-Saharan Africa Sub-Saharan Africa (excluding high income)Sub-Saharan Africa (IDA & IBRD countries)SudanSurinameSwazilandSwedenSwitzerlandSyrian Arab RepublicTajikistanTanzaniaThailandTimor-LesteTogoTongaTrinidad and TobagoTunisiaTurkeyTurkmenistanUgandaUkraineUnited Arab EmiratesUnited KingdomUnited StatesUpper middle incomeUruguayUzbekistanVanuatuVenezuela, RBVietnamWest Bank and GazaWorldYemen, Rep.ZambiaZimbabwe Linha do tempo:
Nesta escala de tempo está apresentado um gráfico de 1971 ano até 2015 ano Latin America & the Caribbean (IDA & IBRD countries). Dados de 1970 ano ausente. O número de observações reais por data: 45.
Fonte (nome):
Indicadores de desenvolvimento mundial
Fonte (organização):
United Nations Educational, Scientific, and Cultural Organization (UNESCO) Institute for Statistics.
Categorias:
Education, Gender
Foi atualizado:
23 abr 2017 ano
Indicadores de alterações dos valores ao longo dos anos
Mínimo:
4.387
1 jan 1971 ano
Máximo:
50.159
1 jan 2015 ano
Na data de observação
Valor
Mudança absoluta
A alteração em relação ao valor anterior
1 jan 1971 ano
4.387
+4.387
0.0%
1 jan 1972 ano
5.127
+0.74
16.86%
1 jan 1973 ano
6.022
+0.895
17.45%
1 jan 1974 ano
6.833
+0.811
13.48%
1 jan 1975 ano
7.956
+1.122
16.42%
1 jan 1976 ano
9.149
+1.194
15.01%
1 jan 1977 ano
9.414
+0.265
2.89%
1 jan 1978 ano
9.622
+0.207
2.2%
1 jan 1979 ano
10.018
+0.397
4.12%
1 jan 1980 ano
10.554
+0.535
5.34%
1 jan 1981 ano
11.084
+0.531
5.03%
1 jan 1982 ano
11.619
+0.534
4.82%
1 jan 1983 ano
11.935
+0.317
2.72%
1 jan 1984 ano
12.399
+0.464
3.88%
1 jan 1985 ano
14.929
+2.53
20.41%
1 jan 1986 ano
15.614
+0.685
4.59%
1 jan 1987 ano
14.162
-1.452
-9.3%
1 jan 1988 ano
14.734
+0.572
4.04%
1 jan 1989 ano
15.15
+0.416
2.82%
1 jan 1990 ano
15.506
+0.356
2.35%
1 jan 1991 ano
15.712
+0.206
1.33%
1 jan 1992 ano
16.11
+0.397
2.53%
1 jan 1993 ano
16.173
+0.063
0.39%
1 jan 1994 ano
16.294
+0.121
0.75%
1 jan 1995 ano
16.661
+0.367
2.25%
1 jan 1996 ano
19.029
+2.368
14.21%
1 jan 1997 ano
18.19
-0.839
-4.41%
1 jan 1998 ano
20.904
+2.714
14.92%
1 jan 1999 ano
21.114
+0.21
1.01%
1 jan 2000 ano
23.59
+2.476
11.73%
1 jan 2001 ano
24.123
+0.533
2.26%
1 jan 2002 ano
25.674
+1.551
6.43%
1 jan 2003 ano
27.899
+2.226
8.67%
1 jan 2004 ano
29.83
+1.93
6.92%
1 jan 2005 ano
30.829
+0.999
3.35%
1 jan 2006 ano
32.635
+1.807
5.86%
1 jan 2007 ano
35.068
+2.432
7.45%
1 jan 2008 ano
37.579
+2.511
7.16%
1 jan 2009 ano
41.066
+3.488
9.28%
1 jan 2010 ano
42.58
+1.514
3.69%
1 jan 2011 ano
44.299
+1.719
4.04%
1 jan 2012 ano
47.026
+2.726
6.15%
1 jan 2013 ano
48.679
+1.653
3.51%
1 jan 2014 ano
49.894
+1.216
2.5%
1 jan 2015 ano
50.159
+0.265
0.53%
Classificação de países por estatísticas atuais por anos


Comentários: