29
/pt/
pt
AIzaSyAYiBZKx7MnpbEhh9jyipgxe19OcubqV5w
April 1, 2024
248034
Spain
ESP
true
2
1
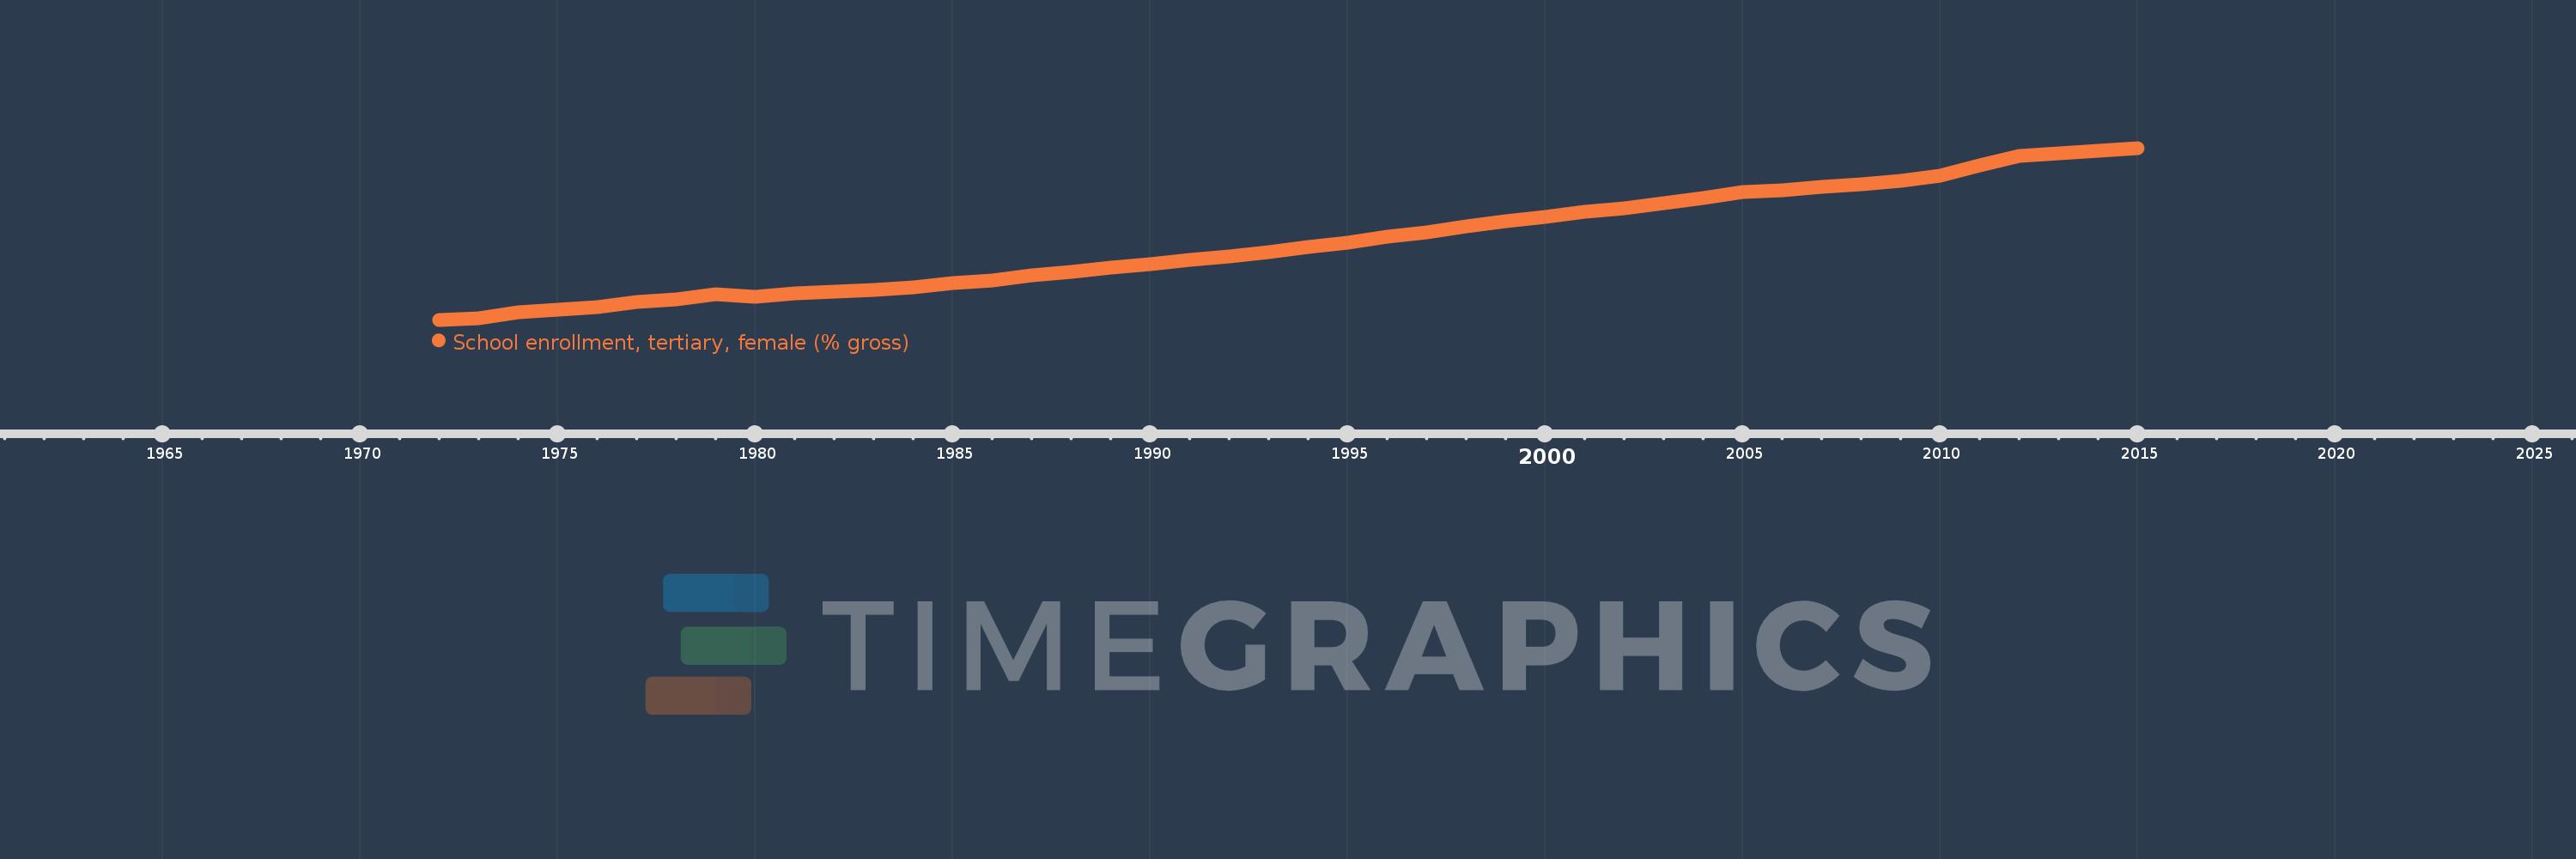
School enrollment, tertiary, female (% gross)
2015,2014,2013,2012,2011,2010,2009,2008,2007,2006,2005,2004,2003,2002,2001,2000,1999,1998,1997,1996,1995,1994,1993,1992,1991,1990,1989,1988,1987,1986,1985,1984,1983,1982,1981,1980,1979,1978,1977,1976,1975,1974,1973,1972
Estas estatísticas em outros países:
AfghanistanAlbaniaAlgeriaAngolaAntigua and BarbudaArab WorldArgentinaArmeniaArubaAustraliaAustriaAzerbaijanBahamas, TheBahrainBangladeshBarbadosBelarusBelgiumBelizeBeninBermudaBhutanBoliviaBosnia and HerzegovinaBotswanaBrazilBrunei DarussalamBulgariaBurkina FasoBurundiCabo VerdeCambodiaCameroonCanadaCaribbean small statesCentral African RepublicCentral Europe and the BalticsChadChileChinaColombiaComorosCongo, Dem. Rep.Congo, Rep.Costa RicaCote d'IvoireCroatiaCubaCuracaoCyprusCzech RepublicDenmarkDjiboutiDominicaDominican RepublicEarly-demographic dividendEast Asia & PacificEast Asia & Pacific (excluding high income)East Asia & Pacific (IDA & IBRD countries)EcuadorEgypt, Arab Rep.El SalvadorEquatorial GuineaEritreaEstoniaEthiopiaEuro areaEurope & Central AsiaEurope & Central Asia (excluding high income)Europe & Central Asia (IDA & IBRD countries)European UnionFijiFinlandFragile and conflict affected situationsFranceGabonGambia, TheGeorgiaGermanyGhanaGreeceGrenadaGuatemalaGuineaGuinea-BissauGuyanaHaitiHeavily indebted poor countries (HIPC)High incomeHondurasHong Kong SAR, ChinaHungaryIBRD onlyIcelandIDA & IBRD totalIDA blendIDA onlyIDA totalIndiaIndonesiaIran, Islamic Rep.IraqIrelandIsraelItalyJamaicaJapanJordanKazakhstanKenyaKorea, Dem. People’s Rep.Korea, Rep.KuwaitKyrgyz RepublicLao PDRLate-demographic dividendLatin America & Caribbean Latin America & Caribbean (excluding high income)Latin America & the Caribbean (IDA & IBRD countries)LatviaLeast developed countries: UN classificationLebanonLesothoLiberiaLibyaLiechtensteinLithuaniaLow & middle incomeLow incomeLower middle incomeLuxembourgMacao SAR, ChinaMacedonia, FYRMadagascarMalawiMaldivesMaliMaltaMarshall IslandsMauritaniaMauritiusMexicoMicronesia, Fed. Sts.Middle East & North AfricaMiddle East & North Africa (excluding high income)Middle East & North Africa (IDA & IBRD countries)Middle incomeMoldovaMongoliaMontenegroMoroccoMozambiqueMyanmarNamibiaNepalNetherlandsNew ZealandNicaraguaNigerNigeriaNorth AmericaNorwayOECD membersOmanOther small statesPacific island small statesPakistanPalauPanamaPapua New GuineaParaguayPeruPhilippinesPolandPortugalPost-demographic dividendPre-demographic dividendPuerto RicoQatarRomaniaRussian FederationRwandaSamoaSan MarinoSao Tome and PrincipeSaudi ArabiaSenegalSerbiaSeychellesSierra LeoneSingaporeSlovak RepublicSloveniaSmall statesSomaliaSouth AfricaSouth AsiaSouth Asia (IDA & IBRD)SpainSri LankaSt. Kitts and NevisSt. LuciaSt. Vincent and the GrenadinesSub-Saharan Africa Sub-Saharan Africa (excluding high income)Sub-Saharan Africa (IDA & IBRD countries)SudanSurinameSwazilandSwedenSwitzerlandSyrian Arab RepublicTajikistanTanzaniaThailandTimor-LesteTogoTongaTrinidad and TobagoTunisiaTurkeyTurkmenistanUgandaUkraineUnited Arab EmiratesUnited KingdomUnited StatesUpper middle incomeUruguayUzbekistanVanuatuVenezuela, RBVietnamWest Bank and GazaWorldYemen, Rep.ZambiaZimbabwe Linha do tempo:
Nesta escala de tempo está apresentado um gráfico de 1972 ano até 2015 ano Spain. Dados de 1971 ano ausente. O número de observações reais por data: 44.
Fonte (nome):
Indicadores de desenvolvimento mundial
Fonte (organização):
United Nations Educational, Scientific, and Cultural Organization (UNESCO) Institute for Statistics.
Categorias:
Education, Gender
Foi atualizado:
23 abr 2017 ano
Indicadores de alterações dos valores ao longo dos anos
Mínimo:
4.688
1 jan 1972 ano
Máximo:
96.93
1 jan 2015 ano
Na data de observação
Valor
Mudança absoluta
A alteração em relação ao valor anterior
1 jan 1972 ano
4.688
+4.688
0.0%
1 jan 1973 ano
5.496
+0.808
17.25%
1 jan 1974 ano
8.799
+3.303
60.09%
1 jan 1975 ano
10.106
+1.307
14.85%
1 jan 1976 ano
11.602
+1.496
14.81%
1 jan 1977 ano
14.29
+2.688
23.17%
1 jan 1978 ano
15.77
+1.48
10.35%
1 jan 1979 ano
18.172
+2.402
15.23%
1 jan 1980 ano
17.077
-1.094
-6.02%
1 jan 1981 ano
18.712
+1.635
9.57%
1 jan 1982 ano
19.558
+0.846
4.52%
1 jan 1983 ano
20.637
+1.079
5.51%
1 jan 1984 ano
21.939
+1.302
6.31%
1 jan 1985 ano
24.249
+2.31
10.53%
1 jan 1986 ano
25.627
+1.378
5.68%
1 jan 1987 ano
28.638
+3.011
11.75%
1 jan 1988 ano
30.217
+1.579
5.51%
1 jan 1989 ano
32.603
+2.386
7.9%
1 jan 1990 ano
34.466
+1.864
5.72%
1 jan 1991 ano
36.901
+2.434
7.06%
1 jan 1992 ano
38.703
+1.802
4.88%
1 jan 1993 ano
41.194
+2.492
6.44%
1 jan 1994 ano
43.589
+2.395
5.81%
1 jan 1995 ano
45.994
+2.405
5.52%
1 jan 1996 ano
49.198
+3.204
6.97%
1 jan 1997 ano
51.594
+2.396
4.87%
1 jan 1998 ano
54.784
+3.19
6.18%
1 jan 1999 ano
57.518
+2.734
4.99%
1 jan 2000 ano
59.929
+2.412
4.19%
1 jan 2001 ano
62.82
+2.891
4.82%
1 jan 2002 ano
64.568
+1.748
2.78%
1 jan 2003 ano
67.422
+2.854
4.42%
1 jan 2004 ano
70.052
+2.629
3.9%
1 jan 2005 ano
73.331
+3.28
4.68%
1 jan 2006 ano
74.392
+1.06
1.45%
1 jan 2007 ano
76.13
+1.739
2.34%
1 jan 2008 ano
77.533
+1.403
1.84%
1 jan 2009 ano
79.377
+1.843
2.38%
1 jan 2010 ano
82.174
+2.797
3.52%
1 jan 2011 ano
87.351
+5.177
6.3%
1 jan 2012 ano
92.451
+5.1
5.84%
1 jan 2013 ano
94.033
+1.581
1.71%
1 jan 2014 ano
95.31
+1.277
1.36%
1 jan 2015 ano
96.93
+1.62
1.7%
Classificação de países por estatísticas atuais por anos


Comentários: