29
/pt/
pt
AIzaSyAYiBZKx7MnpbEhh9jyipgxe19OcubqV5w
April 1, 2024
43830
Latin America & the Caribbean (IDA & IBRD countries)
TLA
false
2
1
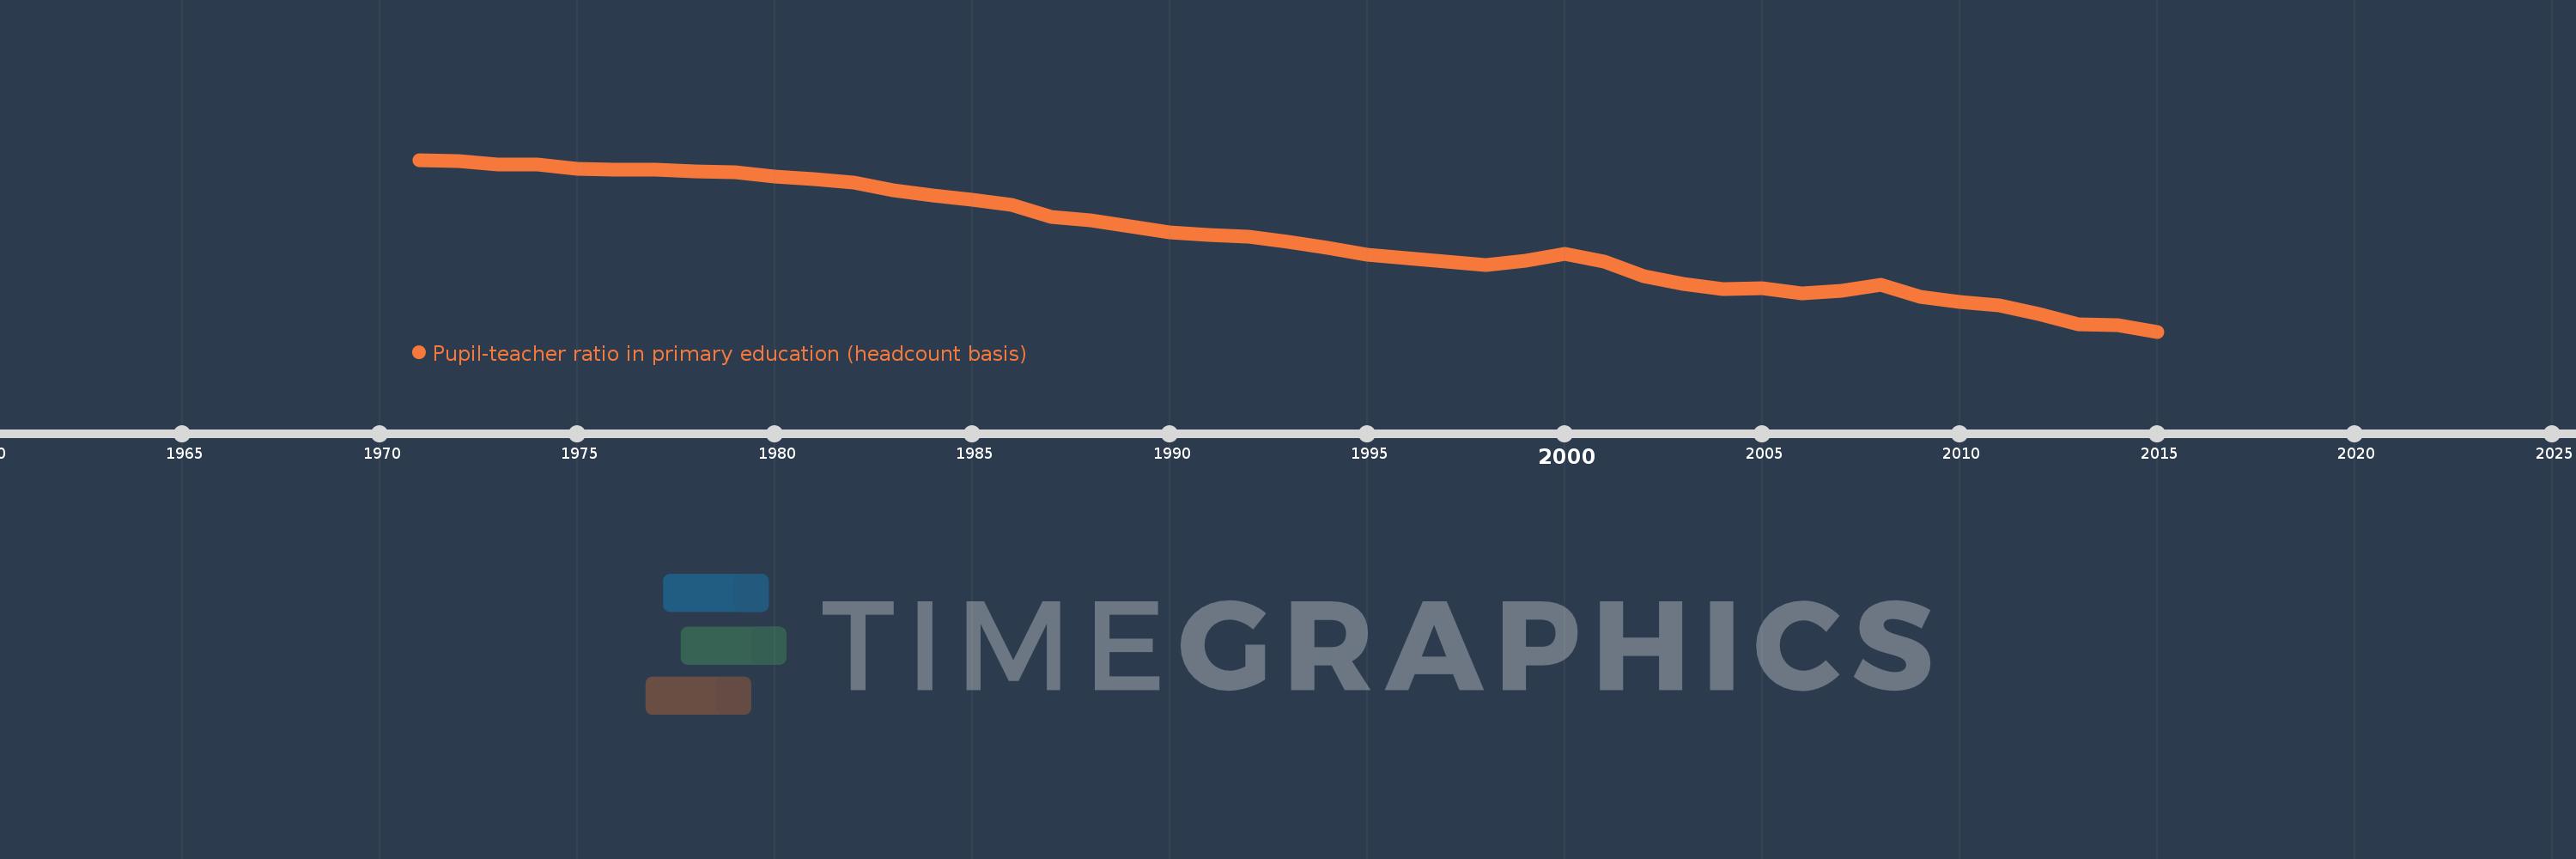
Pupil-teacher ratio in primary education (headcount basis)
2015,2014,2013,2012,2011,2010,2009,2008,2007,2006,2005,2004,2003,2002,2001,2000,1999,1998,1997,1996,1995,1994,1993,1992,1991,1990,1989,1988,1987,1986,1985,1984,1983,1982,1981,1980,1979,1978,1977,1976,1975,1974,1973,1972,1971
Estas estatísticas em outros países:
AfghanistanAlbaniaAlgeriaAndorraAngolaAntigua and BarbudaArab WorldArgentinaArmeniaArubaAustraliaAustriaAzerbaijanBahamas, TheBahrainBangladeshBarbadosBelarusBelgiumBelizeBeninBermudaBhutanBoliviaBosnia and HerzegovinaBotswanaBrazilBritish Virgin IslandsBrunei DarussalamBulgariaBurkina FasoBurundiCabo VerdeCambodiaCameroonCanadaCaribbean small statesCayman IslandsCentral African RepublicCentral Europe and the BalticsChadChileChinaColombiaComorosCongo, Dem. Rep.Congo, Rep.Costa RicaCote d'IvoireCroatiaCubaCyprusCzech RepublicDenmarkDjiboutiDominicaDominican RepublicEarly-demographic dividendEast Asia & PacificEast Asia & Pacific (excluding high income)East Asia & Pacific (IDA & IBRD countries)EcuadorEgypt, Arab Rep.El SalvadorEquatorial GuineaEritreaEstoniaEthiopiaEuro areaEurope & Central AsiaEurope & Central Asia (excluding high income)Europe & Central Asia (IDA & IBRD countries)European UnionFijiFinlandFragile and conflict affected situationsFranceGabonGambia, TheGeorgiaGermanyGhanaGibraltarGreeceGrenadaGuatemalaGuineaGuinea-BissauGuyanaHaitiHeavily indebted poor countries (HIPC)High incomeHondurasHong Kong SAR, ChinaHungaryIBRD onlyIcelandIDA & IBRD totalIDA blendIDA onlyIDA totalIndiaIndonesiaIran, Islamic Rep.IraqIrelandIsraelItalyJamaicaJapanJordanKazakhstanKenyaKiribatiKorea, Dem. People’s Rep.Korea, Rep.KuwaitKyrgyz RepublicLao PDRLate-demographic dividendLatin America & Caribbean Latin America & Caribbean (excluding high income)Latin America & the Caribbean (IDA & IBRD countries)LatviaLeast developed countries: UN classificationLebanonLesothoLiberiaLibyaLiechtensteinLithuaniaLow & middle incomeLow incomeLower middle incomeLuxembourgMacao SAR, ChinaMacedonia, FYRMadagascarMalawiMalaysiaMaldivesMaliMaltaMarshall IslandsMauritaniaMauritiusMexicoMicronesia, Fed. Sts.Middle East & North AfricaMiddle East & North Africa (excluding high income)Middle East & North Africa (IDA & IBRD countries)Middle incomeMoldovaMonacoMongoliaMoroccoMozambiqueMyanmarNamibiaNauruNepalNetherlandsNew ZealandNicaraguaNigerNigeriaNorth AmericaNorwayOECD membersOmanOther small statesPacific island small statesPakistanPalauPanamaPapua New GuineaParaguayPeruPhilippinesPolandPortugalPost-demographic dividendPre-demographic dividendPuerto RicoQatarRomaniaRussian FederationRwandaSamoaSan MarinoSao Tome and PrincipeSaudi ArabiaSenegalSerbiaSeychellesSierra LeoneSingaporeSint Maarten (Dutch part)Slovak RepublicSloveniaSmall statesSolomon IslandsSomaliaSouth AfricaSouth AsiaSouth Asia (IDA & IBRD)South SudanSpainSri LankaSt. Kitts and NevisSt. LuciaSt. Vincent and the GrenadinesSub-Saharan Africa Sub-Saharan Africa (excluding high income)Sub-Saharan Africa (IDA & IBRD countries)SudanSurinameSwazilandSwedenSwitzerlandSyrian Arab RepublicTajikistanTanzaniaThailandTimor-LesteTogoTongaTrinidad and TobagoTunisiaTurkeyTurks and Caicos IslandsTuvaluUgandaUkraineUnited Arab EmiratesUnited KingdomUnited StatesUpper middle incomeUruguayUzbekistanVanuatuVenezuela, RBVietnamWest Bank and GazaWorldYemen, Rep.ZambiaZimbabwe Linha do tempo:
Nesta escala de tempo está apresentado um gráfico de 1971 ano até 2015 ano Latin America & the Caribbean (IDA & IBRD countries). Dados de 1970 ano ausente. O número de observações reais por data: 45.
Fonte (nome):
Indicadores de desenvolvimento mundial
Fonte (organização):
UNESCO Institute for Statistics
Categorias:
Education
Foi atualizado:
23 abr 2017 ano
Indicadores de alterações dos valores ao longo dos anos
Mínimo:
21.895
1 jan 2015 ano
Máximo:
32.214
1 jan 1971 ano
Na data de observação
Valor
Mudança absoluta
A alteração em relação ao valor anterior
1 jan 1971 ano
32.214
+32.214
0.0%
1 jan 1972 ano
32.141
-0.073
-0.23%
1 jan 1973 ano
31.953
-0.188
-0.59%
1 jan 1974 ano
31.91
-0.042
-0.13%
1 jan 1975 ano
31.683
-0.227
-0.71%
1 jan 1976 ano
31.605
-0.078
-0.25%
1 jan 1977 ano
31.603
-0.002
-0.01%
1 jan 1978 ano
31.533
-0.07
-0.22%
1 jan 1979 ano
31.455
-0.079
-0.25%
1 jan 1980 ano
31.197
-0.258
-0.82%
1 jan 1981 ano
31.074
-0.123
-0.39%
1 jan 1982 ano
30.858
-0.216
-0.7%
1 jan 1983 ano
30.399
-0.459
-1.49%
1 jan 1984 ano
30.051
-0.347
-1.14%
1 jan 1985 ano
29.801
-0.251
-0.83%
1 jan 1986 ano
29.516
-0.285
-0.96%
1 jan 1987 ano
28.801
-0.714
-2.42%
1 jan 1988 ano
28.583
-0.218
-0.76%
1 jan 1989 ano
28.212
-0.371
-1.3%
1 jan 1990 ano
27.873
-0.339
-1.2%
1 jan 1991 ano
27.723
-0.15
-0.54%
1 jan 1992 ano
27.577
-0.145
-0.52%
1 jan 1993 ano
27.263
-0.315
-1.14%
1 jan 1994 ano
26.93
-0.333
-1.22%
1 jan 1995 ano
26.504
-0.426
-1.58%
1 jan 1996 ano
26.306
-0.198
-0.75%
1 jan 1997 ano
26.118
-0.188
-0.71%
1 jan 1998 ano
25.906
-0.212
-0.81%
1 jan 1999 ano
26.165
+0.259
1.0%
1 jan 2000 ano
26.542
+0.377
1.44%
1 jan 2001 ano
26.115
-0.428
-1.61%
1 jan 2002 ano
25.202
-0.912
-3.49%
1 jan 2003 ano
24.765
-0.437
-1.74%
1 jan 2004 ano
24.437
-0.328
-1.33%
1 jan 2005 ano
24.512
+0.076
0.31%
1 jan 2006 ano
24.188
-0.325
-1.32%
1 jan 2007 ano
24.37
+0.182
0.75%
1 jan 2008 ano
24.692
+0.322
1.32%
1 jan 2009 ano
23.997
-0.695
-2.81%
1 jan 2010 ano
23.682
-0.315
-1.31%
1 jan 2011 ano
23.451
-0.231
-0.98%
1 jan 2012 ano
22.974
-0.477
-2.03%
1 jan 2013 ano
22.346
-0.628
-2.73%
1 jan 2014 ano
22.261
-0.085
-0.38%
1 jan 2015 ano
21.895
-0.366
-1.64%
Classificação de países por estatísticas atuais por anos


Comentários: