29
/pt/
pt
AIzaSyAYiBZKx7MnpbEhh9jyipgxe19OcubqV5w
April 1, 2024
117354
Cyprus
CYP
true
2
1
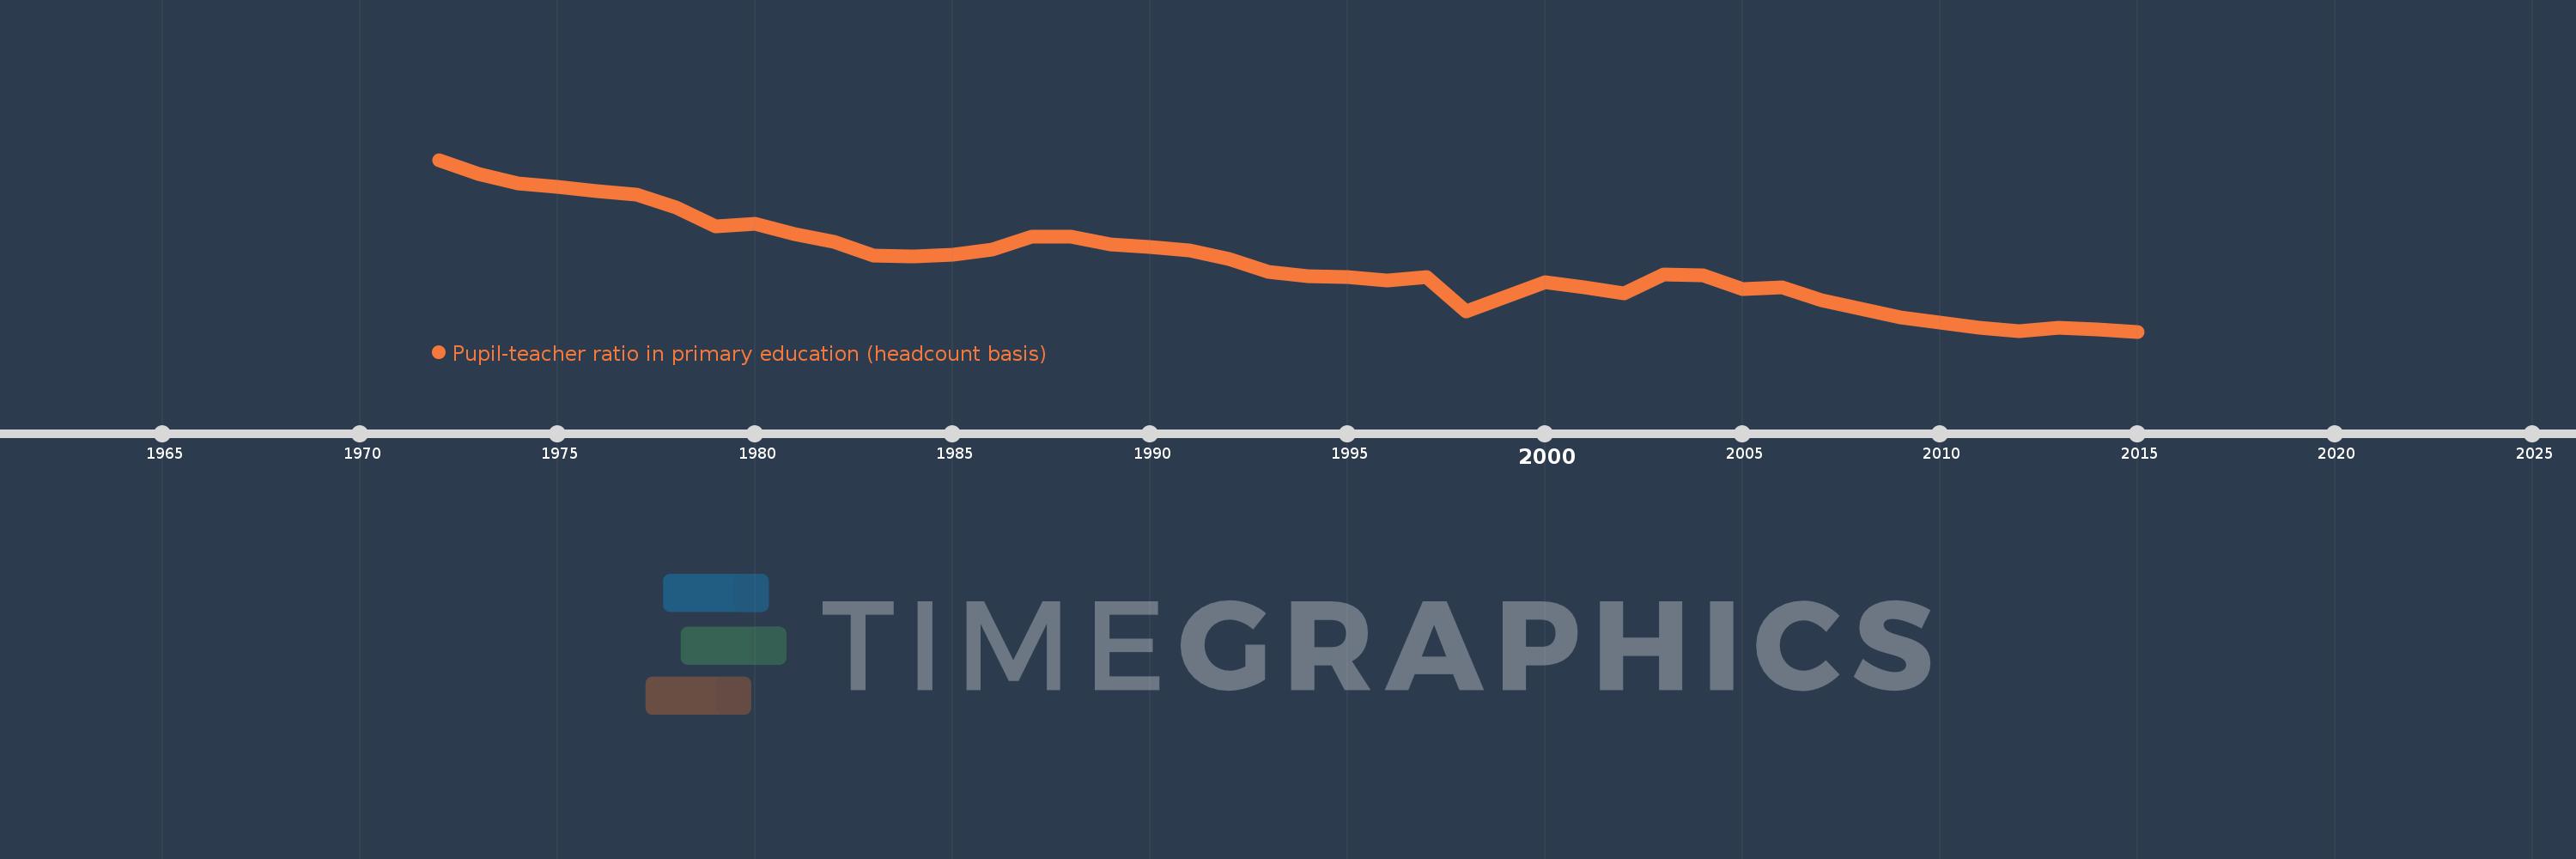
Pupil-teacher ratio in primary education (headcount basis)
2015,2014,2013,2012,2011,2010,2009,2008,2007,2006,2005,2004,2003,2002,2001,2000,1998,1997,1996,1995,1994,1993,1992,1991,1990,1989,1988,1987,1986,1985,1984,1983,1982,1981,1980,1979,1978,1977,1976,1975,1974,1973,1972
Estas estatísticas em outros países:
AfghanistanAlbaniaAlgeriaAndorraAngolaAntigua and BarbudaArab WorldArgentinaArmeniaArubaAustraliaAustriaAzerbaijanBahamas, TheBahrainBangladeshBarbadosBelarusBelgiumBelizeBeninBermudaBhutanBoliviaBosnia and HerzegovinaBotswanaBrazilBritish Virgin IslandsBrunei DarussalamBulgariaBurkina FasoBurundiCabo VerdeCambodiaCameroonCanadaCaribbean small statesCayman IslandsCentral African RepublicCentral Europe and the BalticsChadChileChinaColombiaComorosCongo, Dem. Rep.Congo, Rep.Costa RicaCote d'IvoireCroatiaCubaCyprusCzech RepublicDenmarkDjiboutiDominicaDominican RepublicEarly-demographic dividendEast Asia & PacificEast Asia & Pacific (excluding high income)East Asia & Pacific (IDA & IBRD countries)EcuadorEgypt, Arab Rep.El SalvadorEquatorial GuineaEritreaEstoniaEthiopiaEuro areaEurope & Central AsiaEurope & Central Asia (excluding high income)Europe & Central Asia (IDA & IBRD countries)European UnionFijiFinlandFragile and conflict affected situationsFranceGabonGambia, TheGeorgiaGermanyGhanaGibraltarGreeceGrenadaGuatemalaGuineaGuinea-BissauGuyanaHaitiHeavily indebted poor countries (HIPC)High incomeHondurasHong Kong SAR, ChinaHungaryIBRD onlyIcelandIDA & IBRD totalIDA blendIDA onlyIDA totalIndiaIndonesiaIran, Islamic Rep.IraqIrelandIsraelItalyJamaicaJapanJordanKazakhstanKenyaKiribatiKorea, Dem. People’s Rep.Korea, Rep.KuwaitKyrgyz RepublicLao PDRLate-demographic dividendLatin America & Caribbean Latin America & Caribbean (excluding high income)Latin America & the Caribbean (IDA & IBRD countries)LatviaLeast developed countries: UN classificationLebanonLesothoLiberiaLibyaLiechtensteinLithuaniaLow & middle incomeLow incomeLower middle incomeLuxembourgMacao SAR, ChinaMacedonia, FYRMadagascarMalawiMalaysiaMaldivesMaliMaltaMarshall IslandsMauritaniaMauritiusMexicoMicronesia, Fed. Sts.Middle East & North AfricaMiddle East & North Africa (excluding high income)Middle East & North Africa (IDA & IBRD countries)Middle incomeMoldovaMonacoMongoliaMoroccoMozambiqueMyanmarNamibiaNauruNepalNetherlandsNew ZealandNicaraguaNigerNigeriaNorth AmericaNorwayOECD membersOmanOther small statesPacific island small statesPakistanPalauPanamaPapua New GuineaParaguayPeruPhilippinesPolandPortugalPost-demographic dividendPre-demographic dividendPuerto RicoQatarRomaniaRussian FederationRwandaSamoaSan MarinoSao Tome and PrincipeSaudi ArabiaSenegalSerbiaSeychellesSierra LeoneSingaporeSint Maarten (Dutch part)Slovak RepublicSloveniaSmall statesSolomon IslandsSomaliaSouth AfricaSouth AsiaSouth Asia (IDA & IBRD)South SudanSpainSri LankaSt. Kitts and NevisSt. LuciaSt. Vincent and the GrenadinesSub-Saharan Africa Sub-Saharan Africa (excluding high income)Sub-Saharan Africa (IDA & IBRD countries)SudanSurinameSwazilandSwedenSwitzerlandSyrian Arab RepublicTajikistanTanzaniaThailandTimor-LesteTogoTongaTrinidad and TobagoTunisiaTurkeyTurks and Caicos IslandsTuvaluUgandaUkraineUnited Arab EmiratesUnited KingdomUnited StatesUpper middle incomeUruguayUzbekistanVanuatuVenezuela, RBVietnamWest Bank and GazaWorldYemen, Rep.ZambiaZimbabwe Linha do tempo:
Nesta escala de tempo está apresentado um gráfico de 1972 ano até 2015 ano Cyprus. Dados de 1971 ano ausente. O número de observações reais por data: 43.
Fonte (nome):
Indicadores de desenvolvimento mundial
Fonte (organização):
UNESCO Institute for Statistics
Categorias:
Education
Foi atualizado:
23 abr 2017 ano
Indicadores de alterações dos valores ao longo dos anos
Mínimo:
13.393
1 jan 2015 ano
Máximo:
30.333
1 jan 1972 ano
Na data de observação
Valor
Mudança absoluta
A alteração em relação ao valor anterior
1 jan 1972 ano
30.333
+30.333
0.0%
1 jan 1973 ano
28.908
-1.425
-4.7%
1 jan 1974 ano
27.992
-0.916
-3.17%
1 jan 1975 ano
27.657
-0.335
-1.2%
1 jan 1976 ano
27.261
-0.396
-1.43%
1 jan 1977 ano
26.941
-0.321
-1.18%
1 jan 1978 ano
25.597
-1.344
-4.99%
1 jan 1979 ano
23.778
-1.818
-7.1%
1 jan 1980 ano
23.999
+0.22
0.93%
1 jan 1981 ano
22.99
-1.008
-4.2%
1 jan 1982 ano
22.207
-0.783
-3.41%
1 jan 1983 ano
20.924
-1.284
-5.78%
1 jan 1984 ano
20.801
-0.123
-0.59%
1 jan 1985 ano
21.005
+0.205
0.98%
1 jan 1986 ano
21.517
+0.512
2.44%
1 jan 1987 ano
22.774
+1.256
5.84%
1 jan 1988 ano
22.777
+0.003
0.01%
1 jan 1989 ano
21.962
-0.815
-3.58%
1 jan 1990 ano
21.724
-0.238
-1.08%
1 jan 1991 ano
21.378
-0.346
-1.59%
1 jan 1992 ano
20.515
-0.862
-4.03%
1 jan 1993 ano
19.31
-1.205
-5.87%
1 jan 1994 ano
18.86
-0.45
-2.33%
1 jan 1995 ano
18.781
-0.079
-0.42%
1 jan 1996 ano
18.391
-0.39
-2.08%
1 jan 1997 ano
18.731
+0.34
1.85%
1 jan 1998 ano
15.412
-3.319
-17.72%
1 jan 2000 ano
18.268
+2.856
18.53%
1 jan 2001 ano
17.725
-0.543
-2.97%
1 jan 2002 ano
17.195
-0.531
-2.99%
1 jan 2003 ano
19.026
+1.831
10.65%
1 jan 2004 ano
18.942
-0.084
-0.44%
1 jan 2005 ano
17.607
-1.335
-7.05%
1 jan 2006 ano
17.727
+0.12
0.68%
1 jan 2007 ano
16.463
-1.264
-7.13%
1 jan 2008 ano
15.63
-0.832
-5.06%
1 jan 2009 ano
14.753
-0.877
-5.61%
1 jan 2010 ano
14.241
-0.512
-3.47%
1 jan 2011 ano
13.753
-0.487
-3.42%
1 jan 2012 ano
13.442
-0.312
-2.27%
1 jan 2013 ano
13.775
+0.333
2.48%
1 jan 2014 ano
13.595
-0.179
-1.3%
1 jan 2015 ano
13.393
-0.203
-1.49%
Classificação de países por estatísticas atuais por anos


Comentários: