29
/pt/
pt
AIzaSyAYiBZKx7MnpbEhh9jyipgxe19OcubqV5w
April 1, 2024
43617
Latin America & the Caribbean (IDA & IBRD countries)
TLA
false
2
1
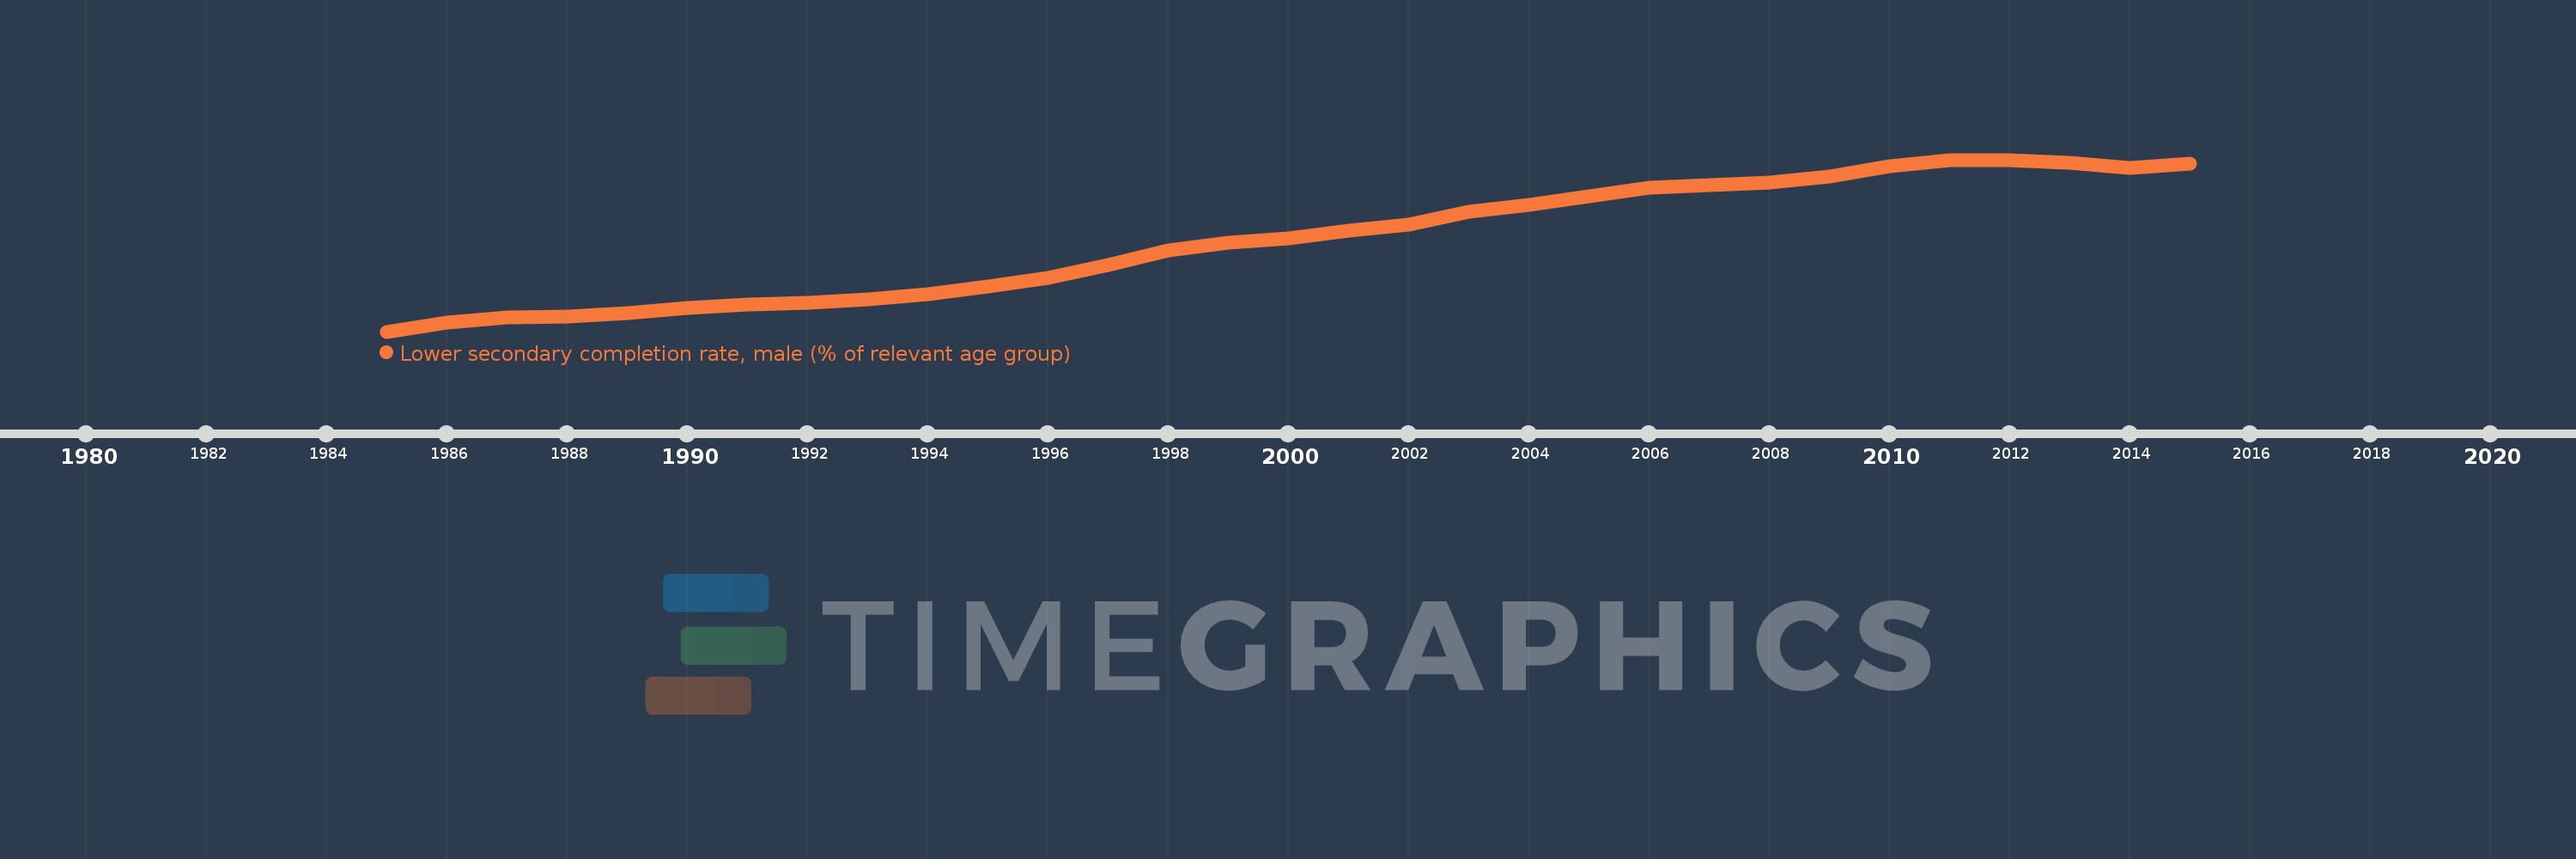
Lower secondary completion rate, male (% of relevant age group)
2015,2014,2013,2012,2011,2010,2009,2008,2007,2006,2005,2004,2003,2002,2001,2000,1999,1998,1997,1996,1995,1994,1993,1992,1991,1990,1989,1988,1987,1986,1985
Estas estatísticas em outros países:
AfghanistanAlbaniaAlgeriaAngolaAntigua and BarbudaArab WorldArgentinaArmeniaArubaAustriaAzerbaijanBahamas, TheBahrainBangladeshBarbadosBelarusBelgiumBelizeBeninBermudaBhutanBoliviaBosnia and HerzegovinaBotswanaBrunei DarussalamBulgariaBurkina FasoBurundiCabo VerdeCambodiaCameroonCaribbean small statesCentral African RepublicCentral Europe and the BalticsChadChileChinaColombiaComorosCongo, Dem. Rep.Congo, Rep.Costa RicaCote d'IvoireCroatiaCubaCyprusCzech RepublicDenmarkDjiboutiDominicaDominican RepublicEarly-demographic dividendEast Asia & PacificEast Asia & Pacific (excluding high income)East Asia & Pacific (IDA & IBRD countries)EcuadorEgypt, Arab Rep.El SalvadorEquatorial GuineaEritreaEstoniaEthiopiaEuro areaEurope & Central AsiaEurope & Central Asia (excluding high income)Europe & Central Asia (IDA & IBRD countries)European UnionFijiFinlandFragile and conflict affected situationsFranceGabonGambia, TheGeorgiaGermanyGhanaGreeceGrenadaGuatemalaGuineaGuinea-BissauGuyanaHaitiHeavily indebted poor countries (HIPC)High incomeHondurasHong Kong SAR, ChinaHungaryIBRD onlyIcelandIDA & IBRD totalIDA blendIDA onlyIDA totalIndiaIndonesiaIran, Islamic Rep.IraqIrelandIsraelItalyJamaicaJapanJordanKazakhstanKenyaKiribatiKorea, Dem. People’s Rep.Korea, Rep.KuwaitKyrgyz RepublicLao PDRLate-demographic dividendLatin America & Caribbean Latin America & Caribbean (excluding high income)Latin America & the Caribbean (IDA & IBRD countries)LatviaLeast developed countries: UN classificationLebanonLesothoLiberiaLiechtensteinLithuaniaLow & middle incomeLow incomeLower middle incomeLuxembourgMacao SAR, ChinaMacedonia, FYRMadagascarMalawiMaldivesMaliMaltaMarshall IslandsMauritaniaMauritiusMexicoMiddle East & North AfricaMiddle East & North Africa (excluding high income)Middle East & North Africa (IDA & IBRD countries)Middle incomeMoldovaMongoliaMontenegroMoroccoMozambiqueMyanmarNamibiaNauruNepalNetherlandsNicaraguaNigerNorwayOECD membersOmanOther small statesPacific island small statesPakistanPalauPanamaPapua New GuineaParaguayPeruPhilippinesPolandPortugalPost-demographic dividendPre-demographic dividendQatarRomaniaRussian FederationRwandaSamoaSan MarinoSao Tome and PrincipeSaudi ArabiaSenegalSerbiaSeychellesSierra LeoneSlovak RepublicSloveniaSmall statesSolomon IslandsSouth AfricaSouth AsiaSouth Asia (IDA & IBRD)South SudanSpainSri LankaSt. Kitts and NevisSt. LuciaSt. Vincent and the GrenadinesSub-Saharan Africa Sub-Saharan Africa (excluding high income)Sub-Saharan Africa (IDA & IBRD countries)SudanSurinameSwazilandSwedenSwitzerlandSyrian Arab RepublicTajikistanTanzaniaThailandTimor-LesteTogoTongaTrinidad and TobagoTunisiaTurkeyTuvaluUgandaUkraineUnited Arab EmiratesUpper middle incomeUruguayUzbekistanVanuatuVenezuela, RBVietnamWest Bank and GazaWorldYemen, Rep.ZambiaZimbabwe Linha do tempo:
Nesta escala de tempo está apresentado um gráfico de 1985 ano até 2015 ano Latin America & the Caribbean (IDA & IBRD countries). Dados de 1984 ano ausente. O número de observações reais por data: 31.
Fonte (nome):
Indicadores de desenvolvimento mundial
Fonte (organização):
United Nations Educational, Scientific, and Cultural Organization (UNESCO) Institute for Statistics.
Categorias:
Education
Foi atualizado:
23 abr 2017 ano
Indicadores de alterações dos valores ao longo dos anos
Mínimo:
54.82
1 jan 1985 ano
Máximo:
74.583
1 jan 2011 ano
Na data de observação
Valor
Mudança absoluta
A alteração em relação ao valor anterior
1 jan 1985 ano
54.82
+54.82
0.0%
1 jan 1986 ano
55.819
+0.999
1.82%
1 jan 1987 ano
56.423
+0.604
1.08%
1 jan 1988 ano
56.549
+0.126
0.22%
1 jan 1989 ano
56.955
+0.406
0.72%
1 jan 1990 ano
57.554
+0.599
1.05%
1 jan 1991 ano
57.885
+0.331
0.58%
1 jan 1992 ano
58.161
+0.276
0.48%
1 jan 1993 ano
58.532
+0.37
0.64%
1 jan 1994 ano
59.085
+0.553
0.95%
1 jan 1995 ano
60.048
+0.964
1.63%
1 jan 1996 ano
60.951
+0.903
1.5%
1 jan 1997 ano
62.467
+1.515
2.49%
1 jan 1998 ano
64.173
+1.707
2.73%
1 jan 1999 ano
65.089
+0.916
1.43%
1 jan 2000 ano
65.502
+0.412
0.63%
1 jan 2001 ano
66.47
+0.968
1.48%
1 jan 2002 ano
67.136
+0.666
1.0%
1 jan 2003 ano
68.642
+1.506
2.24%
1 jan 2004 ano
69.429
+0.787
1.15%
1 jan 2005 ano
70.367
+0.938
1.35%
1 jan 2006 ano
71.363
+0.996
1.41%
1 jan 2007 ano
71.668
+0.305
0.43%
1 jan 2008 ano
71.978
+0.31
0.43%
1 jan 2009 ano
72.647
+0.669
0.93%
1 jan 2010 ano
73.847
+1.2
1.65%
1 jan 2011 ano
74.583
+0.736
1.0%
1 jan 2012 ano
74.575
-0.007
-0.01%
1 jan 2013 ano
74.235
-0.341
-0.46%
1 jan 2014 ano
73.689
-0.546
-0.73%
1 jan 2015 ano
74.171
+0.482
0.65%
Classificação de países por estatísticas atuais por anos


Comentários: