29
/pt/
pt
AIzaSyAYiBZKx7MnpbEhh9jyipgxe19OcubqV5w
April 1, 2024
161700
Italy
ITA
true
2
1
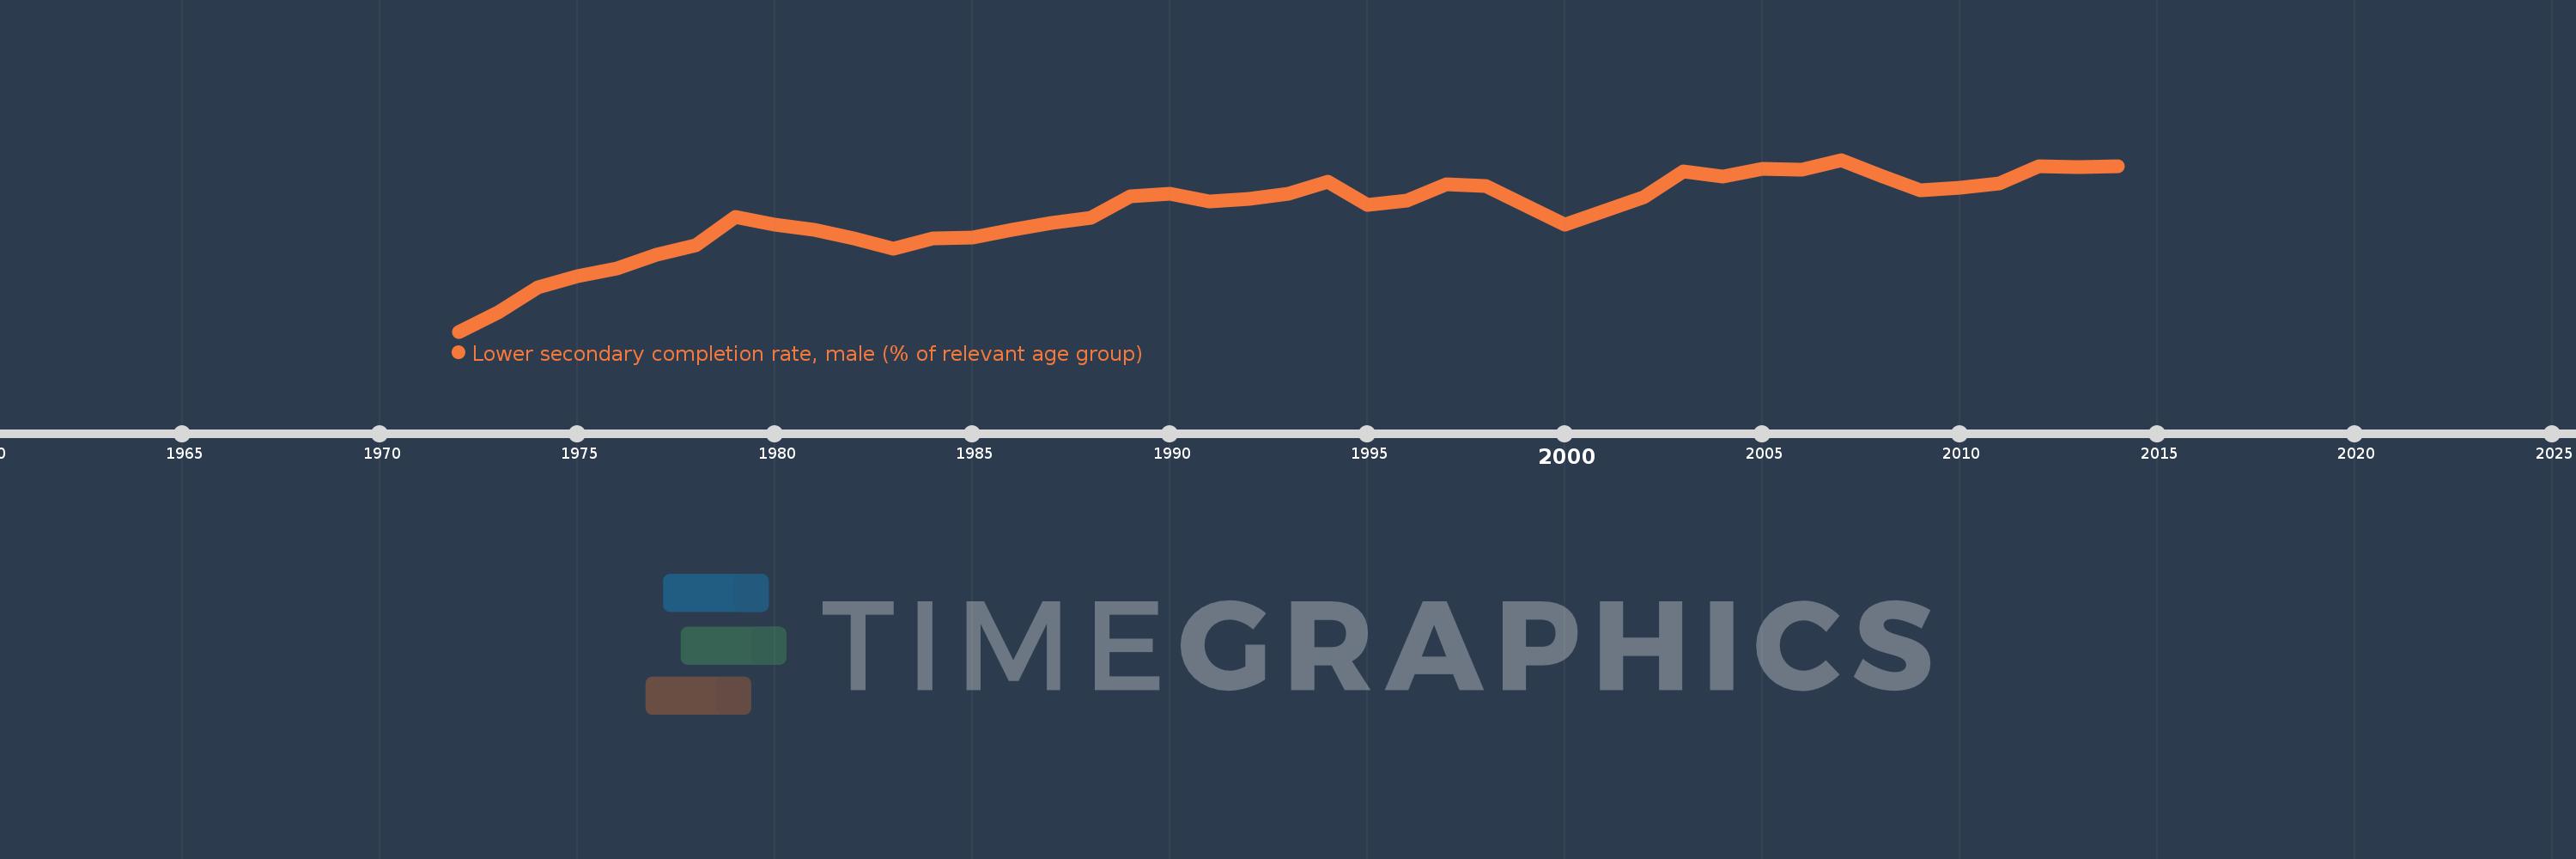
Lower secondary completion rate, male (% of relevant age group)
2014,2013,2012,2011,2010,2009,2008,2007,2006,2005,2004,2003,2002,2000,1998,1997,1996,1995,1994,1993,1992,1991,1990,1989,1988,1987,1986,1985,1984,1983,1982,1981,1980,1979,1978,1977,1976,1975,1974,1973,1972
Estas estatísticas em outros países:
AfghanistanAlbaniaAlgeriaAngolaAntigua and BarbudaArab WorldArgentinaArmeniaArubaAustriaAzerbaijanBahamas, TheBahrainBangladeshBarbadosBelarusBelgiumBelizeBeninBermudaBhutanBoliviaBosnia and HerzegovinaBotswanaBrunei DarussalamBulgariaBurkina FasoBurundiCabo VerdeCambodiaCameroonCaribbean small statesCentral African RepublicCentral Europe and the BalticsChadChileChinaColombiaComorosCongo, Dem. Rep.Congo, Rep.Costa RicaCote d'IvoireCroatiaCubaCyprusCzech RepublicDenmarkDjiboutiDominicaDominican RepublicEarly-demographic dividendEast Asia & PacificEast Asia & Pacific (excluding high income)East Asia & Pacific (IDA & IBRD countries)EcuadorEgypt, Arab Rep.El SalvadorEquatorial GuineaEritreaEstoniaEthiopiaEuro areaEurope & Central AsiaEurope & Central Asia (excluding high income)Europe & Central Asia (IDA & IBRD countries)European UnionFijiFinlandFragile and conflict affected situationsFranceGabonGambia, TheGeorgiaGermanyGhanaGreeceGrenadaGuatemalaGuineaGuinea-BissauGuyanaHaitiHeavily indebted poor countries (HIPC)High incomeHondurasHong Kong SAR, ChinaHungaryIBRD onlyIcelandIDA & IBRD totalIDA blendIDA onlyIDA totalIndiaIndonesiaIran, Islamic Rep.IraqIrelandIsraelItalyJamaicaJapanJordanKazakhstanKenyaKiribatiKorea, Dem. People’s Rep.Korea, Rep.KuwaitKyrgyz RepublicLao PDRLate-demographic dividendLatin America & Caribbean Latin America & Caribbean (excluding high income)Latin America & the Caribbean (IDA & IBRD countries)LatviaLeast developed countries: UN classificationLebanonLesothoLiberiaLiechtensteinLithuaniaLow & middle incomeLow incomeLower middle incomeLuxembourgMacao SAR, ChinaMacedonia, FYRMadagascarMalawiMaldivesMaliMaltaMarshall IslandsMauritaniaMauritiusMexicoMiddle East & North AfricaMiddle East & North Africa (excluding high income)Middle East & North Africa (IDA & IBRD countries)Middle incomeMoldovaMongoliaMontenegroMoroccoMozambiqueMyanmarNamibiaNauruNepalNetherlandsNicaraguaNigerNorwayOECD membersOmanOther small statesPacific island small statesPakistanPalauPanamaPapua New GuineaParaguayPeruPhilippinesPolandPortugalPost-demographic dividendPre-demographic dividendQatarRomaniaRussian FederationRwandaSamoaSan MarinoSao Tome and PrincipeSaudi ArabiaSenegalSerbiaSeychellesSierra LeoneSlovak RepublicSloveniaSmall statesSolomon IslandsSouth AfricaSouth AsiaSouth Asia (IDA & IBRD)South SudanSpainSri LankaSt. Kitts and NevisSt. LuciaSt. Vincent and the GrenadinesSub-Saharan Africa Sub-Saharan Africa (excluding high income)Sub-Saharan Africa (IDA & IBRD countries)SudanSurinameSwazilandSwedenSwitzerlandSyrian Arab RepublicTajikistanTanzaniaThailandTimor-LesteTogoTongaTrinidad and TobagoTunisiaTurkeyTuvaluUgandaUkraineUnited Arab EmiratesUpper middle incomeUruguayUzbekistanVanuatuVenezuela, RBVietnamWest Bank and GazaWorldYemen, Rep.ZambiaZimbabwe Linha do tempo:
Nesta escala de tempo está apresentado um gráfico de 1972 ano até 2014 ano Italy. Dados de 1971 ano ausente. O número de observações reais por data: 41.
Fonte (nome):
Indicadores de desenvolvimento mundial
Fonte (organização):
United Nations Educational, Scientific, and Cultural Organization (UNESCO) Institute for Statistics.
Categorias:
Education
Foi atualizado:
23 abr 2017 ano
Indicadores de alterações dos valores ao longo dos anos
Mínimo:
72.815
1 jan 1972 ano
Máximo:
103.965
1 jan 2007 ano
Na data de observação
Valor
Mudança absoluta
A alteração em relação ao valor anterior
1 jan 1972 ano
72.815
+72.815
0.0%
1 jan 1973 ano
76.39
+3.575
4.91%
1 jan 1974 ano
80.903
+4.513
5.91%
1 jan 1975 ano
82.859
+1.955
2.42%
1 jan 1976 ano
84.206
+1.347
1.63%
1 jan 1977 ano
86.745
+2.539
3.02%
1 jan 1978 ano
88.542
+1.797
2.07%
1 jan 1979 ano
93.662
+5.12
5.78%
1 jan 1980 ano
92.28
-1.383
-1.48%
1 jan 1981 ano
91.309
-0.971
-1.05%
1 jan 1982 ano
89.745
-1.564
-1.71%
1 jan 1983 ano
87.873
-1.872
-2.09%
1 jan 1984 ano
89.685
+1.812
2.06%
1 jan 1985 ano
89.808
+0.123
0.14%
1 jan 1986 ano
91.287
+1.479
1.65%
1 jan 1987 ano
92.518
+1.231
1.35%
1 jan 1988 ano
93.404
+0.885
0.96%
1 jan 1989 ano
97.329
+3.925
4.2%
1 jan 1990 ano
97.842
+0.513
0.53%
1 jan 1991 ano
96.485
-1.357
-1.39%
1 jan 1992 ano
96.947
+0.462
0.48%
1 jan 1993 ano
97.779
+0.832
0.86%
1 jan 1994 ano
100.071
+2.292
2.34%
1 jan 1995 ano
95.816
-4.255
-4.25%
1 jan 1996 ano
96.574
+0.758
0.79%
1 jan 1997 ano
99.476
+2.902
3.0%
1 jan 1998 ano
99.253
-0.223
-0.22%
1 jan 2000 ano
92.202
-7.051
-7.1%
1 jan 2002 ano
97.266
+5.064
5.49%
1 jan 2003 ano
101.921
+4.655
4.79%
1 jan 2004 ano
100.933
-0.988
-0.97%
1 jan 2005 ano
102.297
+1.364
1.35%
1 jan 2006 ano
102.212
-0.085
-0.08%
1 jan 2007 ano
103.965
+1.753
1.71%
1 jan 2008 ano
101.108
-2.856
-2.75%
1 jan 2009 ano
98.468
-2.64
-2.61%
1 jan 2010 ano
98.929
+0.461
0.47%
1 jan 2011 ano
99.742
+0.813
0.82%
1 jan 2012 ano
102.743
+3.0
3.01%
1 jan 2013 ano
102.695
-0.048
-0.05%
1 jan 2014 ano
102.847
+0.152
0.15%
Classificação de países por estatísticas atuais por anos


Comentários: