29
/pt/
pt
AIzaSyAYiBZKx7MnpbEhh9jyipgxe19OcubqV5w
April 1, 2024
42911
Latin America & Caribbean (excluding high income)
LAC
false
2
1
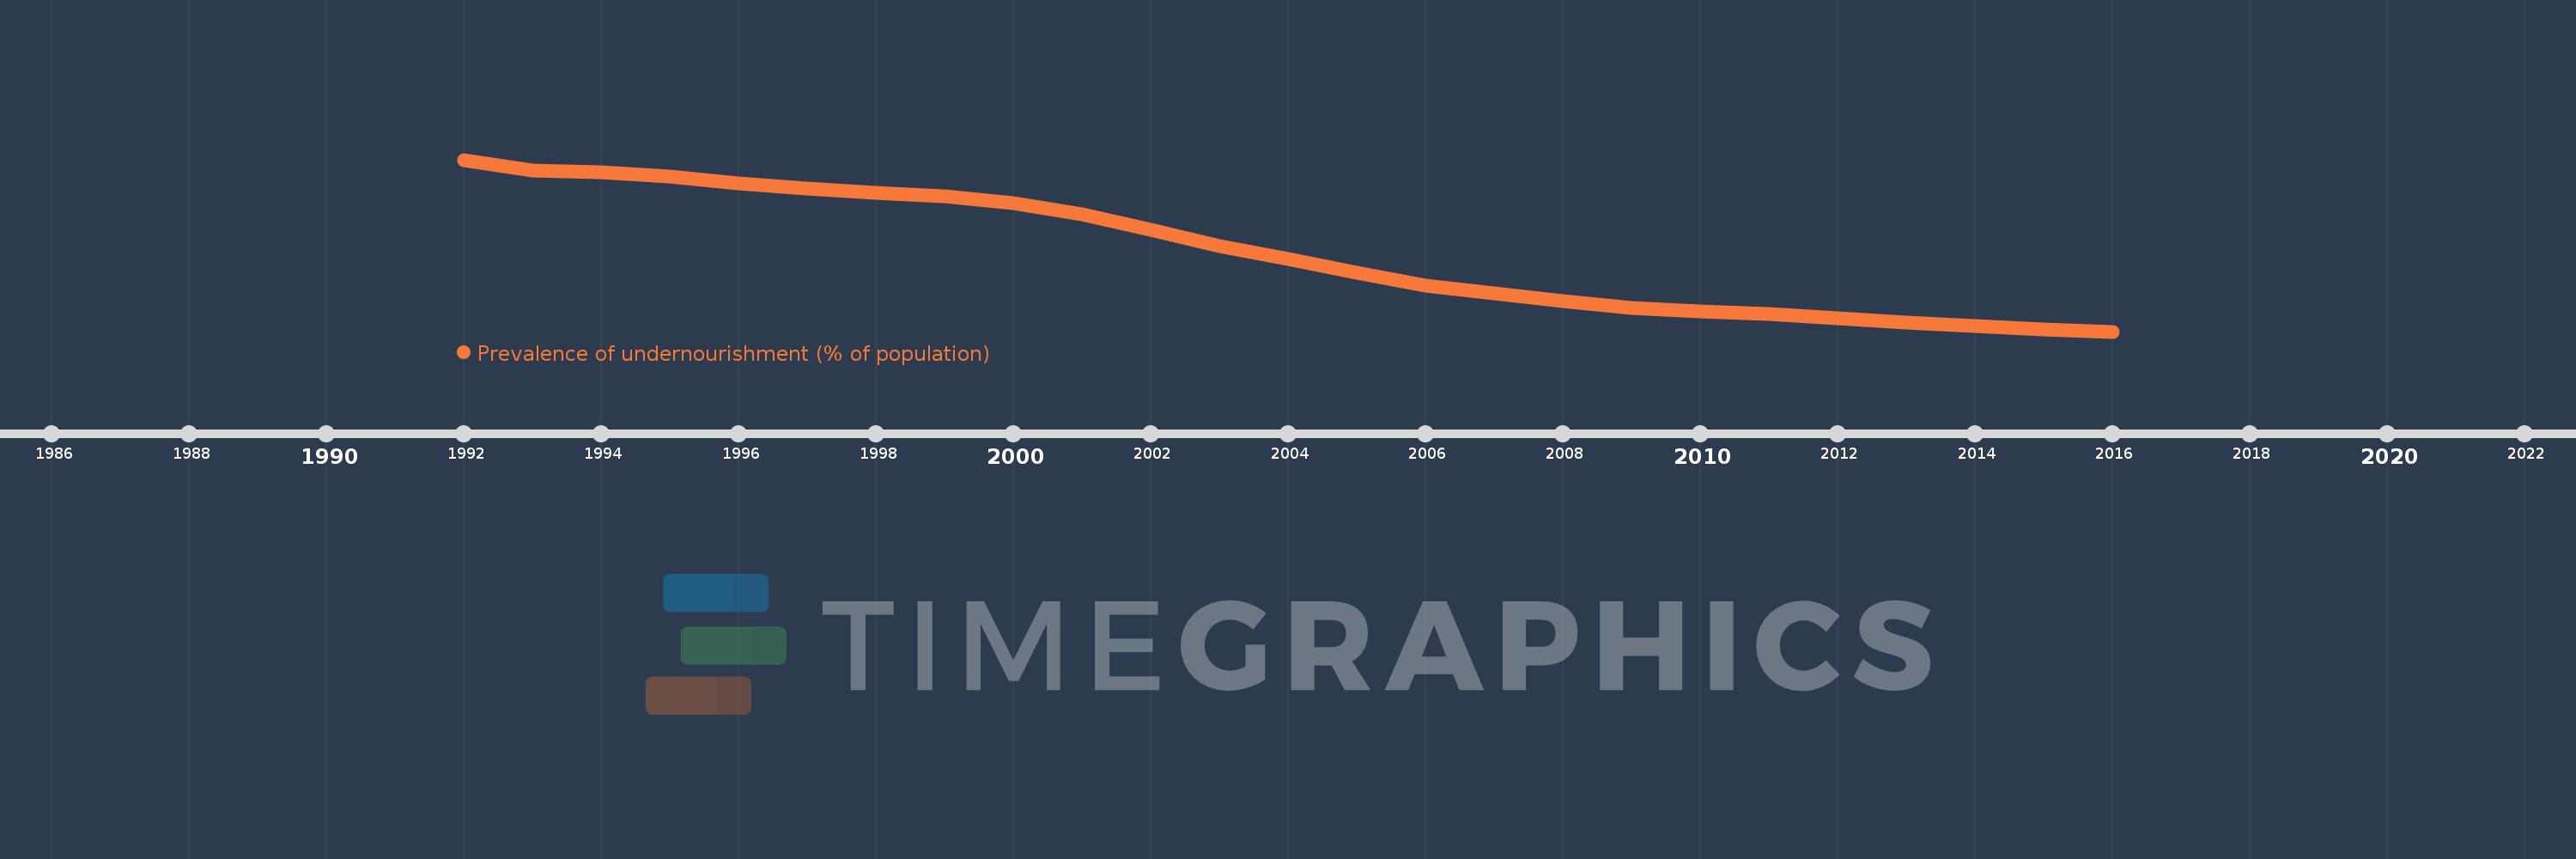
Prevalence of undernourishment (% of population)
2016,2015,2014,2013,2012,2011,2010,2009,2008,2007,2006,2005,2004,2003,2002,2001,2000,1999,1998,1997,1996,1995,1994,1993,1992
Estas estatísticas em outros países:
Linha do tempo:
Nesta escala de tempo está apresentado um gráfico de 1992 ano até 2016 ano Latin America & Caribbean (excluding high income). Dados de 1991 ano ausente. O número de observações reais por data: 25.
Fonte (nome):
Indicadores de desenvolvimento mundial
Fonte (organização):
Food and Agriculture Organization (http://www.fao.org/publications/en/).
Categorias:
Health
Foi atualizado:
23 abr 2017 ano
Indicadores de alterações dos valores ao longo dos anos
Mínimo:
7.454
1 jan 2016 ano
Máximo:
15.173
1 jan 1992 ano
Na data de observação
Valor
Mudança absoluta
A alteração em relação ao valor anterior
1 jan 1992 ano
15.173
+15.173
0.0%
1 jan 1993 ano
14.69
-0.483
-3.18%
1 jan 1994 ano
14.621
-0.069
-0.47%
1 jan 1995 ano
14.402
-0.22
-1.5%
1 jan 1996 ano
14.118
-0.284
-1.97%
1 jan 1997 ano
13.891
-0.226
-1.6%
1 jan 1998 ano
13.671
-0.22
-1.58%
1 jan 1999 ano
13.549
-0.122
-0.89%
1 jan 2000 ano
13.232
-0.317
-2.34%
1 jan 2001 ano
12.728
-0.504
-3.81%
1 jan 2002 ano
12.045
-0.683
-5.37%
1 jan 2003 ano
11.306
-0.74
-6.14%
1 jan 2004 ano
10.711
-0.595
-5.26%
1 jan 2005 ano
10.081
-0.63
-5.88%
1 jan 2006 ano
9.526
-0.555
-5.51%
1 jan 2007 ano
9.175
-0.351
-3.68%
1 jan 2008 ano
8.807
-0.368
-4.01%
1 jan 2009 ano
8.517
-0.29
-3.29%
1 jan 2010 ano
8.379
-0.138
-1.62%
1 jan 2011 ano
8.263
-0.116
-1.38%
1 jan 2012 ano
8.069
-0.194
-2.35%
1 jan 2013 ano
7.862
-0.206
-2.56%
1 jan 2014 ano
7.697
-0.166
-2.11%
1 jan 2015 ano
7.564
-0.132
-1.72%
1 jan 2016 ano
7.454
-0.11
-1.45%
Classificação de países por estatísticas atuais por anos


Comentários: