29
/pt/
pt
AIzaSyAYiBZKx7MnpbEhh9jyipgxe19OcubqV5w
April 1, 2024
37720
IDA & IBRD total
IBT
false
2
1
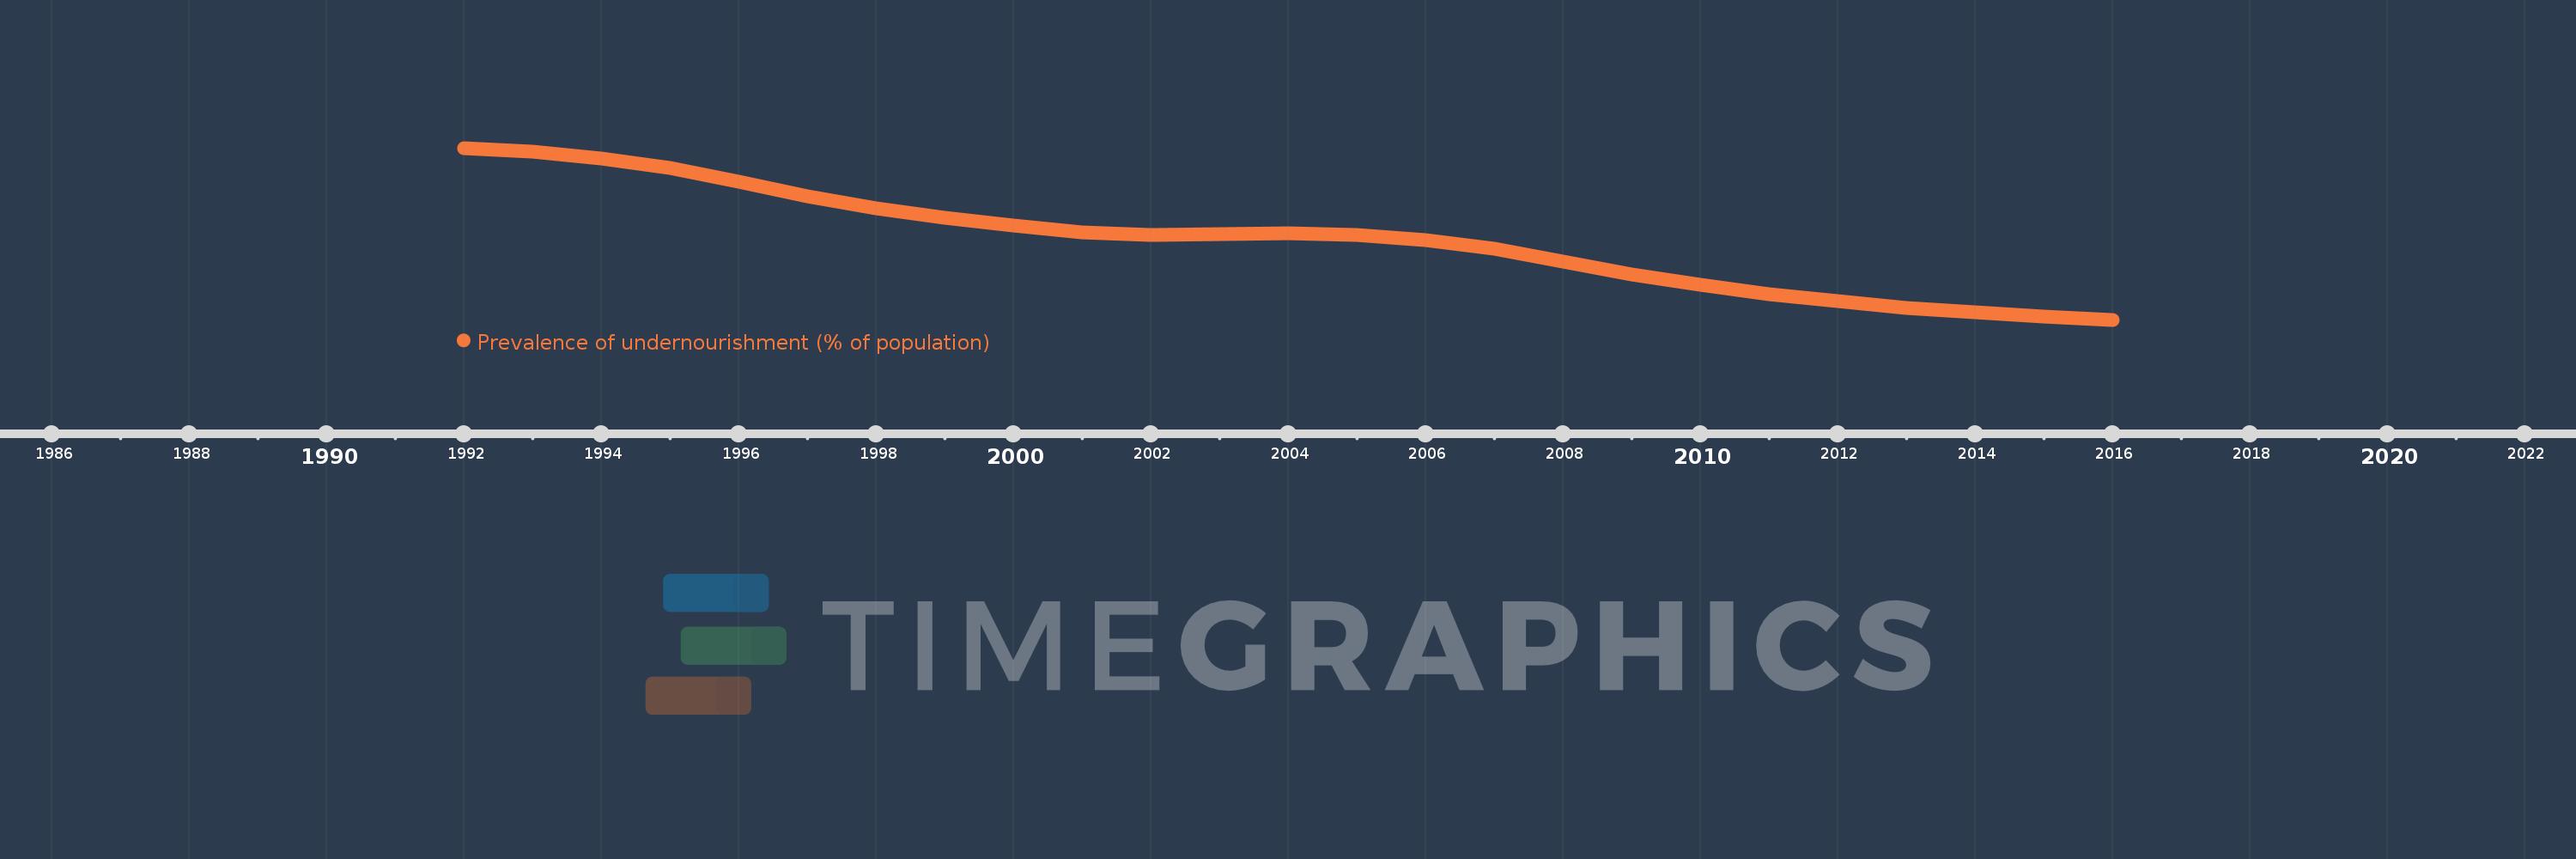
Prevalence of undernourishment (% of population)
2016,2015,2014,2013,2012,2011,2010,2009,2008,2007,2006,2005,2004,2003,2002,2001,2000,1999,1998,1997,1996,1995,1994,1993,1992
Estas estatísticas em outros países:
Linha do tempo:
Nesta escala de tempo está apresentado um gráfico de 1992 ano até 2016 ano IDA & IBRD total. Dados de 1991 ano ausente. O número de observações reais por data: 25.
Fonte (nome):
Indicadores de desenvolvimento mundial
Fonte (organização):
Food and Agriculture Organization (http://www.fao.org/publications/en/).
Categorias:
Health
Foi atualizado:
23 abr 2017 ano
Indicadores de alterações dos valores ao longo dos anos
Mínimo:
12.519
1 jan 2016 ano
Máximo:
23.705
1 jan 1992 ano
Na data de observação
Valor
Mudança absoluta
A alteração em relação ao valor anterior
1 jan 1992 ano
23.705
+23.705
0.0%
1 jan 1993 ano
23.476
-0.229
-0.96%
1 jan 1994 ano
23.044
-0.432
-1.84%
1 jan 1995 ano
22.418
-0.626
-2.71%
1 jan 1996 ano
21.486
-0.932
-4.16%
1 jan 1997 ano
20.551
-0.935
-4.35%
1 jan 1998 ano
19.786
-0.764
-3.72%
1 jan 1999 ano
19.157
-0.629
-3.18%
1 jan 2000 ano
18.639
-0.518
-2.7%
1 jan 2001 ano
18.223
-0.416
-2.23%
1 jan 2002 ano
18.045
-0.178
-0.98%
1 jan 2003 ano
18.072
+0.027
0.15%
1 jan 2004 ano
18.145
+0.072
0.4%
1 jan 2005 ano
18.02
-0.125
-0.69%
1 jan 2006 ano
17.689
-0.33
-1.83%
1 jan 2007 ano
17.121
-0.568
-3.21%
1 jan 2008 ano
16.322
-0.799
-4.66%
1 jan 2009 ano
15.478
-0.844
-5.17%
1 jan 2010 ano
14.778
-0.7
-4.52%
1 jan 2011 ano
14.188
-0.59
-3.99%
1 jan 2012 ano
13.713
-0.476
-3.35%
1 jan 2013 ano
13.292
-0.42
-3.06%
1 jan 2014 ano
13.012
-0.281
-2.11%
1 jan 2015 ano
12.738
-0.274
-2.1%
1 jan 2016 ano
12.519
-0.219
-1.72%
Classificação de países por estatísticas atuais por anos


Comentários: