29
/pt/
pt
AIzaSyAYiBZKx7MnpbEhh9jyipgxe19OcubqV5w
April 1, 2024
38577
IDA blend
IDB
false
2
1
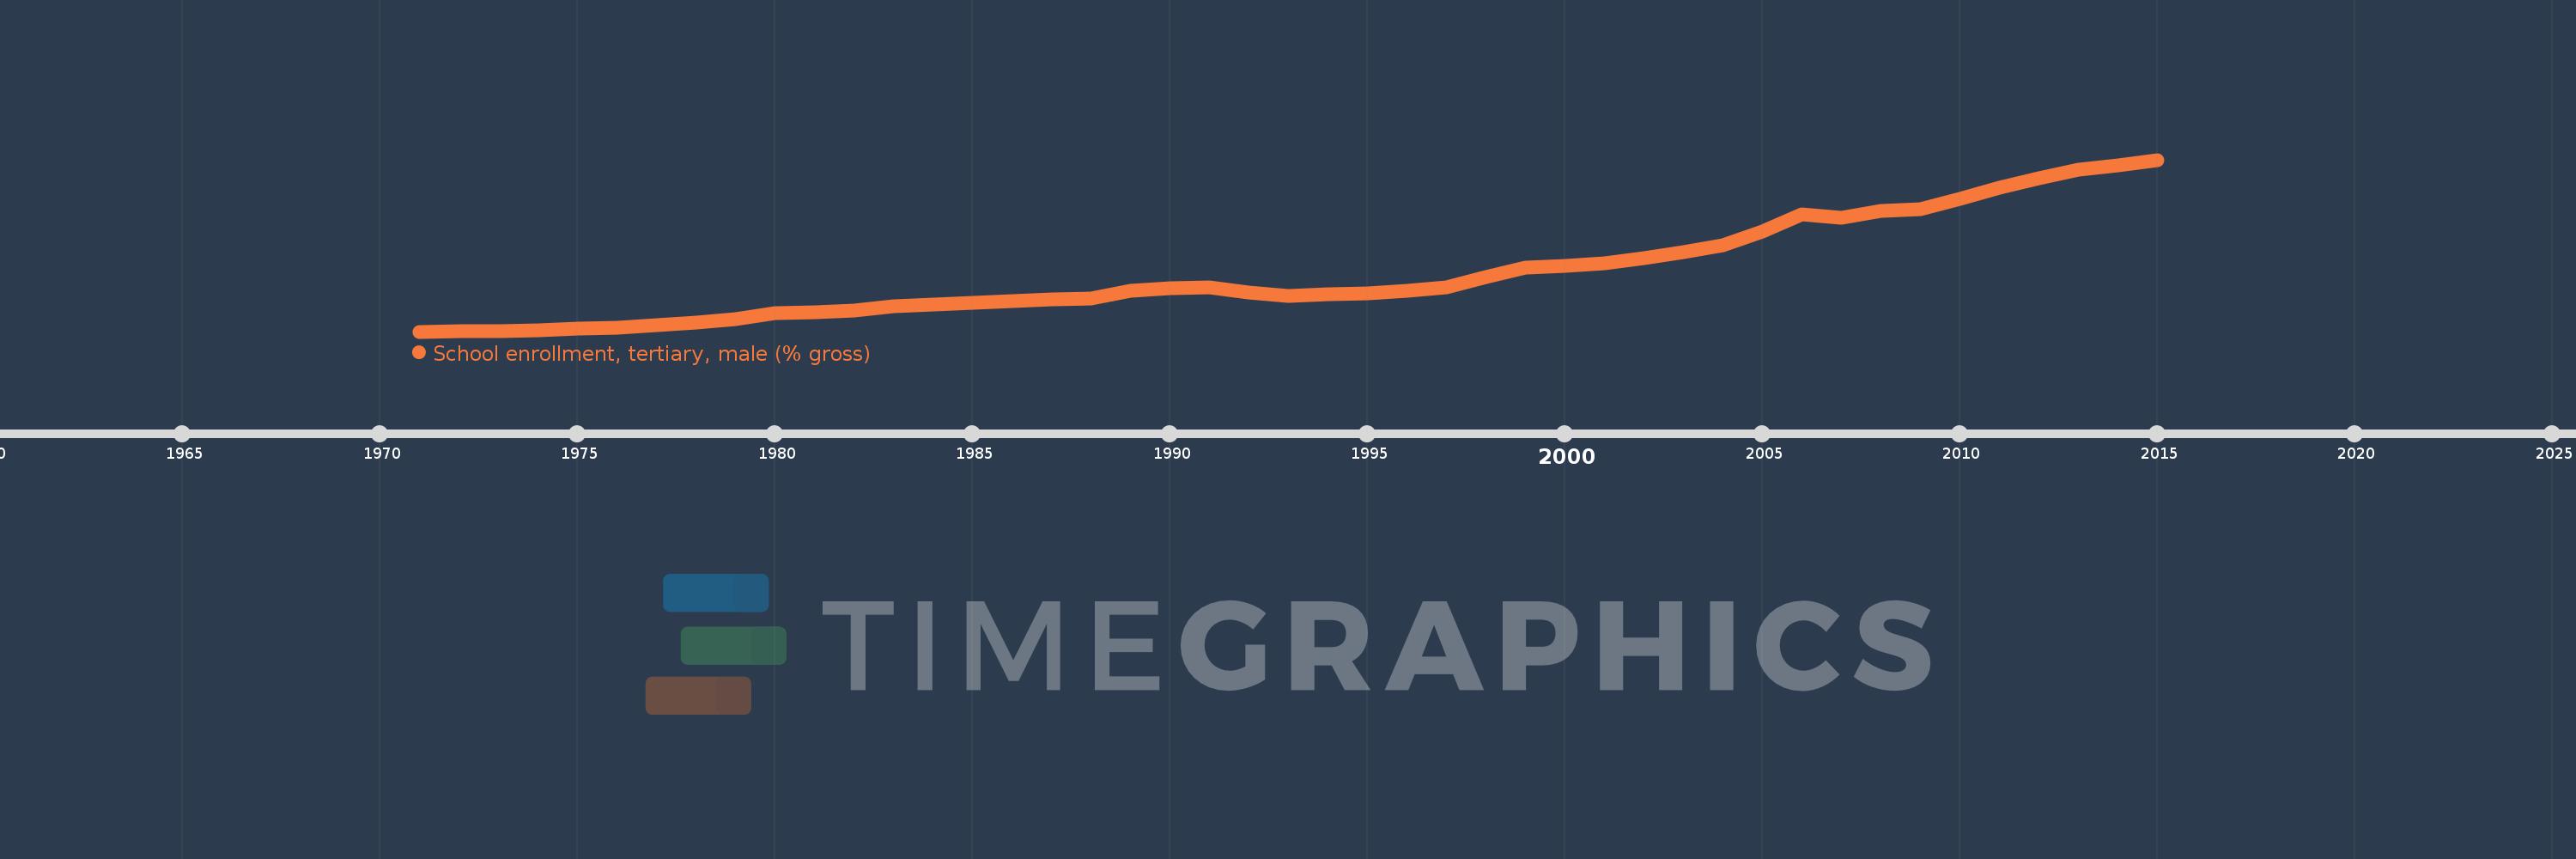
School enrollment, tertiary, male (% gross)
2015,2014,2013,2012,2011,2010,2009,2008,2007,2006,2005,2004,2003,2002,2001,2000,1999,1998,1997,1996,1995,1994,1993,1992,1991,1990,1989,1988,1987,1986,1985,1984,1983,1982,1981,1980,1979,1978,1977,1976,1975,1974,1973,1972,1971
Estas estatísticas em outros países:
AfghanistanAlbaniaAlgeriaAngolaAntigua and BarbudaArab WorldArgentinaArmeniaArubaAustraliaAustriaAzerbaijanBahamas, TheBahrainBangladeshBarbadosBelarusBelgiumBelizeBeninBermudaBhutanBoliviaBosnia and HerzegovinaBotswanaBrazilBrunei DarussalamBulgariaBurkina FasoBurundiCabo VerdeCambodiaCameroonCanadaCaribbean small statesCentral African RepublicCentral Europe and the BalticsChadChileChinaColombiaComorosCongo, Dem. Rep.Congo, Rep.Costa RicaCote d'IvoireCroatiaCubaCuracaoCyprusCzech RepublicDenmarkDjiboutiDominicaDominican RepublicEarly-demographic dividendEast Asia & PacificEast Asia & Pacific (excluding high income)East Asia & Pacific (IDA & IBRD countries)EcuadorEgypt, Arab Rep.El SalvadorEquatorial GuineaEritreaEstoniaEthiopiaEuro areaEurope & Central AsiaEurope & Central Asia (excluding high income)Europe & Central Asia (IDA & IBRD countries)European UnionFijiFinlandFragile and conflict affected situationsFranceGabonGambia, TheGeorgiaGermanyGhanaGreeceGrenadaGuatemalaGuineaGuinea-BissauGuyanaHaitiHeavily indebted poor countries (HIPC)High incomeHondurasHong Kong SAR, ChinaHungaryIBRD onlyIcelandIDA & IBRD totalIDA blendIDA onlyIDA totalIndiaIndonesiaIran, Islamic Rep.IraqIrelandIsraelItalyJamaicaJapanJordanKazakhstanKenyaKorea, Dem. People’s Rep.Korea, Rep.KuwaitKyrgyz RepublicLao PDRLate-demographic dividendLatin America & Caribbean Latin America & Caribbean (excluding high income)Latin America & the Caribbean (IDA & IBRD countries)LatviaLeast developed countries: UN classificationLebanonLesothoLiberiaLibyaLiechtensteinLithuaniaLow & middle incomeLow incomeLower middle incomeLuxembourgMacao SAR, ChinaMacedonia, FYRMadagascarMalawiMaldivesMaliMaltaMarshall IslandsMauritaniaMauritiusMexicoMicronesia, Fed. Sts.Middle East & North AfricaMiddle East & North Africa (excluding high income)Middle East & North Africa (IDA & IBRD countries)Middle incomeMoldovaMongoliaMontenegroMoroccoMozambiqueMyanmarNamibiaNepalNetherlandsNew ZealandNicaraguaNigerNigeriaNorth AmericaNorwayOECD membersOmanOther small statesPacific island small statesPakistanPalauPanamaPapua New GuineaParaguayPeruPhilippinesPolandPortugalPost-demographic dividendPre-demographic dividendPuerto RicoQatarRomaniaRussian FederationRwandaSamoaSan MarinoSao Tome and PrincipeSaudi ArabiaSenegalSerbiaSeychellesSierra LeoneSingaporeSlovak RepublicSloveniaSmall statesSomaliaSouth AfricaSouth AsiaSouth Asia (IDA & IBRD)SpainSri LankaSt. Kitts and NevisSt. LuciaSt. Vincent and the GrenadinesSub-Saharan Africa Sub-Saharan Africa (excluding high income)Sub-Saharan Africa (IDA & IBRD countries)SudanSurinameSwazilandSwedenSwitzerlandSyrian Arab RepublicTajikistanTanzaniaThailandTimor-LesteTogoTongaTrinidad and TobagoTunisiaTurkeyTurkmenistanUgandaUkraineUnited Arab EmiratesUnited KingdomUnited StatesUpper middle incomeUruguayUzbekistanVanuatuVenezuela, RBVietnamWest Bank and GazaWorldYemen, Rep.ZambiaZimbabwe Linha do tempo:
Nesta escala de tempo está apresentado um gráfico de 1971 ano até 2015 ano IDA blend. Dados de 1970 ano ausente. O número de observações reais por data: 45.
Fonte (nome):
Indicadores de desenvolvimento mundial
Fonte (organização):
United Nations Educational, Scientific, and Cultural Organization (UNESCO) Institute for Statistics.
Categorias:
Education, Gender
Foi atualizado:
23 abr 2017 ano
Indicadores de alterações dos valores ao longo dos anos
Mínimo:
3.431
1 jan 1971 ano
Máximo:
14.958
1 jan 2015 ano
Na data de observação
Valor
Mudança absoluta
A alteração em relação ao valor anterior
1 jan 1971 ano
3.431
+3.431
0.0%
1 jan 1972 ano
3.487
+0.056
1.63%
1 jan 1973 ano
3.434
-0.053
-1.51%
1 jan 1974 ano
3.54
+0.105
3.06%
1 jan 1975 ano
3.647
+0.107
3.02%
1 jan 1976 ano
3.691
+0.044
1.22%
1 jan 1977 ano
3.845
+0.154
4.17%
1 jan 1978 ano
4.061
+0.216
5.61%
1 jan 1979 ano
4.295
+0.235
5.78%
1 jan 1980 ano
4.645
+0.35
8.14%
1 jan 1981 ano
4.709
+0.064
1.38%
1 jan 1982 ano
4.854
+0.145
3.09%
1 jan 1983 ano
5.119
+0.264
5.44%
1 jan 1984 ano
5.238
+0.12
2.34%
1 jan 1985 ano
5.352
+0.113
2.17%
1 jan 1986 ano
5.498
+0.146
2.73%
1 jan 1987 ano
5.597
+0.1
1.81%
1 jan 1988 ano
5.675
+0.077
1.38%
1 jan 1989 ano
6.175
+0.5
8.81%
1 jan 1990 ano
6.344
+0.17
2.75%
1 jan 1991 ano
6.378
+0.034
0.53%
1 jan 1992 ano
6.04
-0.338
-5.29%
1 jan 1993 ano
5.826
-0.215
-3.55%
1 jan 1994 ano
5.938
+0.113
1.93%
1 jan 1995 ano
6.004
+0.066
1.11%
1 jan 1996 ano
6.171
+0.167
2.78%
1 jan 1997 ano
6.424
+0.252
4.09%
1 jan 1998 ano
7.101
+0.677
10.54%
1 jan 1999 ano
7.719
+0.618
8.71%
1 jan 2000 ano
7.851
+0.133
1.72%
1 jan 2001 ano
8.003
+0.151
1.93%
1 jan 2002 ano
8.381
+0.379
4.73%
1 jan 2003 ano
8.765
+0.384
4.59%
1 jan 2004 ano
9.227
+0.462
5.27%
1 jan 2005 ano
10.166
+0.939
10.18%
1 jan 2006 ano
11.277
+1.11
10.92%
1 jan 2007 ano
11.07
-0.206
-1.83%
1 jan 2008 ano
11.513
+0.443
4.0%
1 jan 2009 ano
11.654
+0.141
1.23%
1 jan 2010 ano
12.356
+0.702
6.02%
1 jan 2011 ano
13.086
+0.73
5.91%
1 jan 2012 ano
13.71
+0.624
4.77%
1 jan 2013 ano
14.324
+0.613
4.47%
1 jan 2014 ano
14.56
+0.236
1.65%
1 jan 2015 ano
14.958
+0.398
2.74%
Classificação de países por estatísticas atuais por anos


Comentários: