29
/pt/
pt
AIzaSyAYiBZKx7MnpbEhh9jyipgxe19OcubqV5w
April 1, 2024
270047
Turkey
TUR
true
2
1
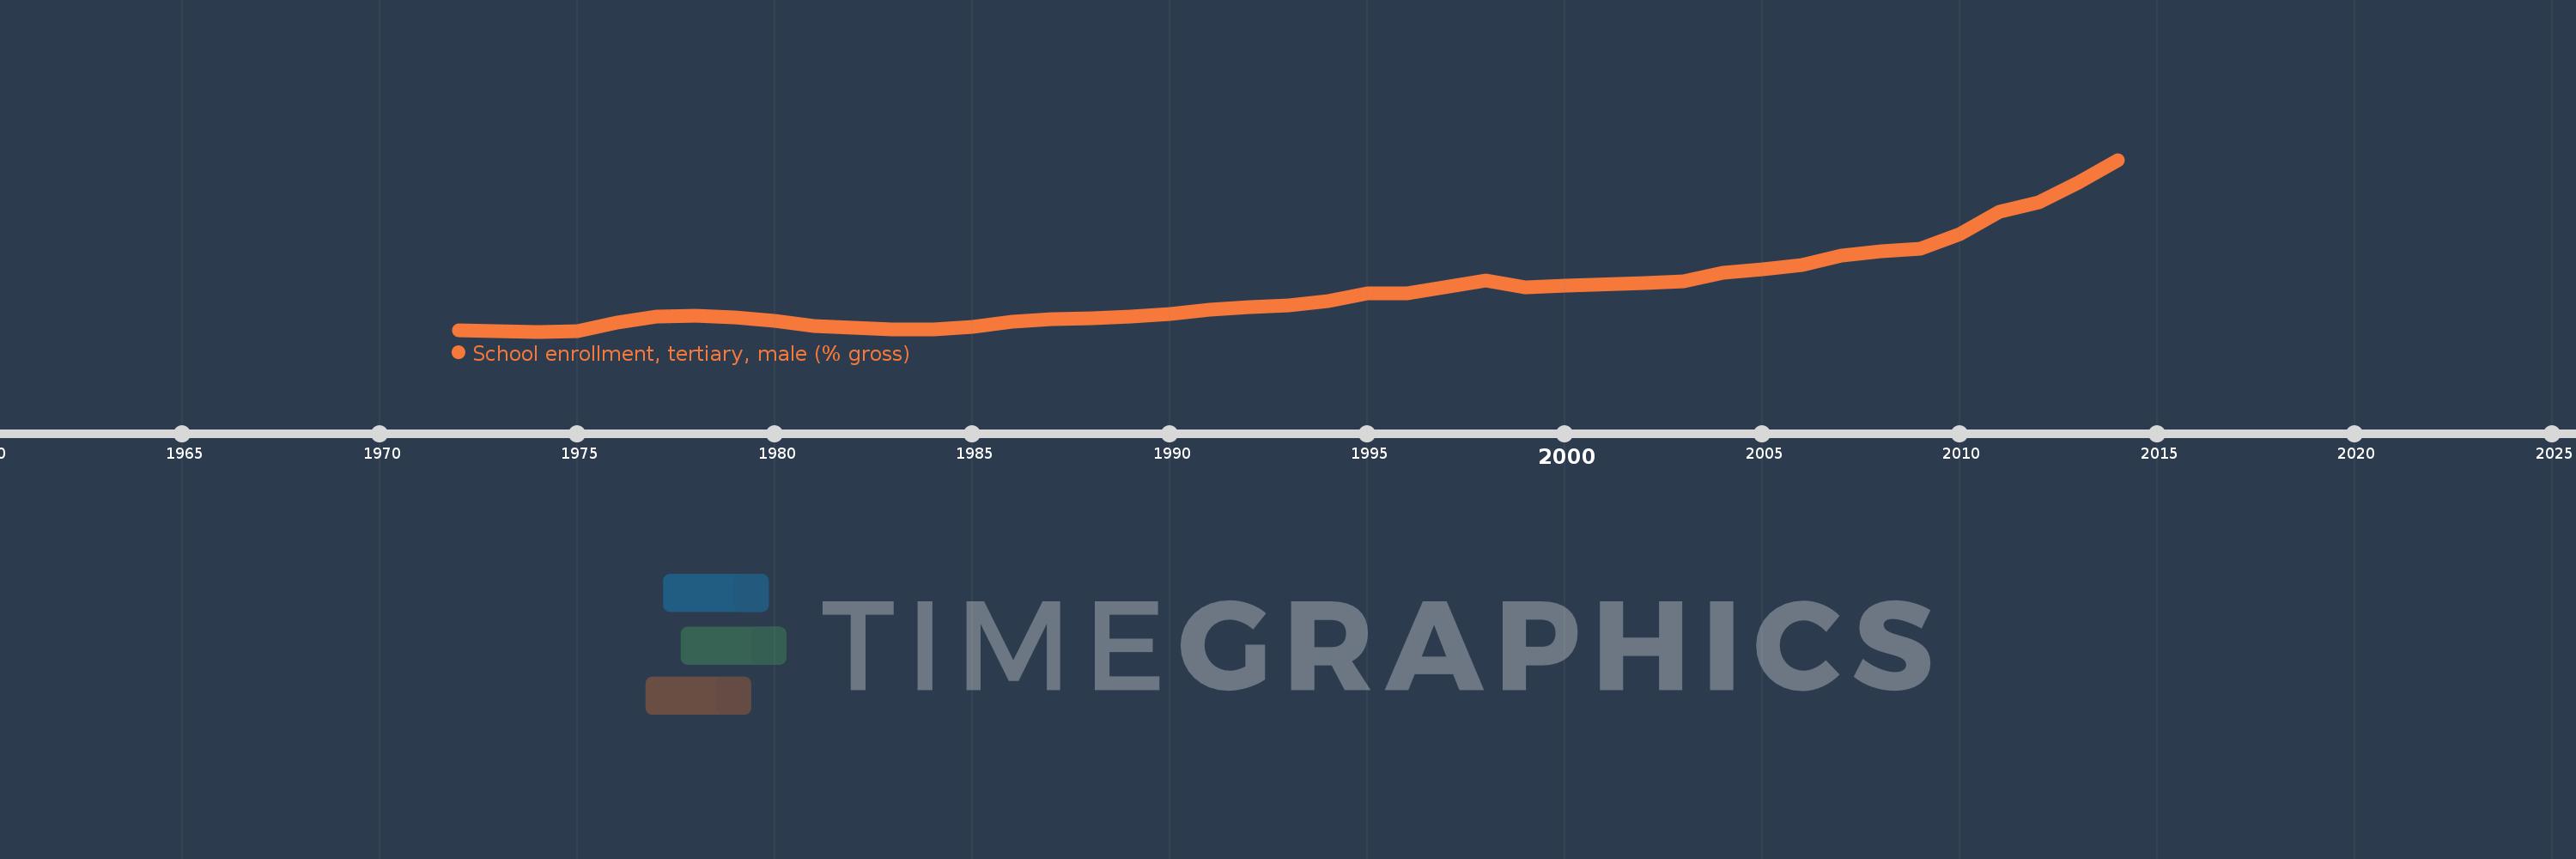
School enrollment, tertiary, male (% gross)
2014,2013,2012,2011,2010,2009,2008,2007,2006,2005,2004,2003,2002,2000,1999,1998,1996,1995,1994,1993,1992,1991,1990,1989,1988,1987,1986,1985,1984,1983,1981,1980,1979,1978,1977,1976,1975,1974,1973,1972
Estas estatísticas em outros países:
AfghanistanAlbaniaAlgeriaAngolaAntigua and BarbudaArab WorldArgentinaArmeniaArubaAustraliaAustriaAzerbaijanBahamas, TheBahrainBangladeshBarbadosBelarusBelgiumBelizeBeninBermudaBhutanBoliviaBosnia and HerzegovinaBotswanaBrazilBrunei DarussalamBulgariaBurkina FasoBurundiCabo VerdeCambodiaCameroonCanadaCaribbean small statesCentral African RepublicCentral Europe and the BalticsChadChileChinaColombiaComorosCongo, Dem. Rep.Congo, Rep.Costa RicaCote d'IvoireCroatiaCubaCuracaoCyprusCzech RepublicDenmarkDjiboutiDominicaDominican RepublicEarly-demographic dividendEast Asia & PacificEast Asia & Pacific (excluding high income)East Asia & Pacific (IDA & IBRD countries)EcuadorEgypt, Arab Rep.El SalvadorEquatorial GuineaEritreaEstoniaEthiopiaEuro areaEurope & Central AsiaEurope & Central Asia (excluding high income)Europe & Central Asia (IDA & IBRD countries)European UnionFijiFinlandFragile and conflict affected situationsFranceGabonGambia, TheGeorgiaGermanyGhanaGreeceGrenadaGuatemalaGuineaGuinea-BissauGuyanaHaitiHeavily indebted poor countries (HIPC)High incomeHondurasHong Kong SAR, ChinaHungaryIBRD onlyIcelandIDA & IBRD totalIDA blendIDA onlyIDA totalIndiaIndonesiaIran, Islamic Rep.IraqIrelandIsraelItalyJamaicaJapanJordanKazakhstanKenyaKorea, Dem. People’s Rep.Korea, Rep.KuwaitKyrgyz RepublicLao PDRLate-demographic dividendLatin America & Caribbean Latin America & Caribbean (excluding high income)Latin America & the Caribbean (IDA & IBRD countries)LatviaLeast developed countries: UN classificationLebanonLesothoLiberiaLibyaLiechtensteinLithuaniaLow & middle incomeLow incomeLower middle incomeLuxembourgMacao SAR, ChinaMacedonia, FYRMadagascarMalawiMaldivesMaliMaltaMarshall IslandsMauritaniaMauritiusMexicoMicronesia, Fed. Sts.Middle East & North AfricaMiddle East & North Africa (excluding high income)Middle East & North Africa (IDA & IBRD countries)Middle incomeMoldovaMongoliaMontenegroMoroccoMozambiqueMyanmarNamibiaNepalNetherlandsNew ZealandNicaraguaNigerNigeriaNorth AmericaNorwayOECD membersOmanOther small statesPacific island small statesPakistanPalauPanamaPapua New GuineaParaguayPeruPhilippinesPolandPortugalPost-demographic dividendPre-demographic dividendPuerto RicoQatarRomaniaRussian FederationRwandaSamoaSan MarinoSao Tome and PrincipeSaudi ArabiaSenegalSerbiaSeychellesSierra LeoneSingaporeSlovak RepublicSloveniaSmall statesSomaliaSouth AfricaSouth AsiaSouth Asia (IDA & IBRD)SpainSri LankaSt. Kitts and NevisSt. LuciaSt. Vincent and the GrenadinesSub-Saharan Africa Sub-Saharan Africa (excluding high income)Sub-Saharan Africa (IDA & IBRD countries)SudanSurinameSwazilandSwedenSwitzerlandSyrian Arab RepublicTajikistanTanzaniaThailandTimor-LesteTogoTongaTrinidad and TobagoTunisiaTurkeyTurkmenistanUgandaUkraineUnited Arab EmiratesUnited KingdomUnited StatesUpper middle incomeUruguayUzbekistanVanuatuVenezuela, RBVietnamWest Bank and GazaWorldYemen, Rep.ZambiaZimbabwe Linha do tempo:
Nesta escala de tempo está apresentado um gráfico de 1972 ano até 2014 ano Turkey. Dados de 1971 ano ausente. O número de observações reais por data: 40.
Fonte (nome):
Indicadores de desenvolvimento mundial
Fonte (organização):
United Nations Educational, Scientific, and Cultural Organization (UNESCO) Institute for Statistics.
Categorias:
Education, Gender
Foi atualizado:
23 abr 2017 ano
Indicadores de alterações dos valores ao longo dos anos
Mínimo:
7.827
1 jan 1974 ano
Máximo:
84.914
1 jan 2014 ano
Na data de observação
Valor
Mudança absoluta
A alteração em relação ao valor anterior
1 jan 1972 ano
8.405
+8.405
0.0%
1 jan 1973 ano
7.993
-0.412
-4.9%
1 jan 1974 ano
7.827
-0.166
-2.08%
1 jan 1975 ano
8.119
+0.292
3.73%
1 jan 1976 ano
11.683
+3.564
43.89%
1 jan 1977 ano
14.424
+2.742
23.47%
1 jan 1978 ano
15.08
+0.655
4.54%
1 jan 1979 ano
14.242
-0.837
-5.55%
1 jan 1980 ano
12.808
-1.434
-10.07%
1 jan 1981 ano
10.223
-2.585
-20.18%
1 jan 1983 ano
8.628
-1.596
-15.61%
1 jan 1984 ano
8.828
+0.2
2.32%
1 jan 1985 ano
9.763
+0.935
10.59%
1 jan 1986 ano
12.319
+2.556
26.18%
1 jan 1987 ano
13.428
+1.109
9.0%
1 jan 1988 ano
13.901
+0.473
3.52%
1 jan 1989 ano
14.404
+0.503
3.62%
1 jan 1990 ano
15.592
+1.188
8.25%
1 jan 1991 ano
17.553
+1.96
12.57%
1 jan 1992 ano
18.704
+1.152
6.56%
1 jan 1993 ano
19.607
+0.903
4.83%
1 jan 1994 ano
21.656
+2.05
10.45%
1 jan 1995 ano
25.124
+3.468
16.01%
1 jan 1996 ano
24.885
-0.239
-0.95%
1 jan 1998 ano
30.682
+5.797
23.3%
1 jan 1999 ano
27.663
-3.02
-9.84%
1 jan 2000 ano
28.281
+0.618
2.23%
1 jan 2002 ano
29.745
+1.464
5.18%
1 jan 2003 ano
30.54
+0.795
2.67%
1 jan 2004 ano
34.24
+3.7
12.12%
1 jan 2005 ano
35.655
+1.415
4.13%
1 jan 2006 ano
37.799
+2.144
6.01%
1 jan 2007 ano
41.837
+4.038
10.68%
1 jan 2008 ano
43.819
+1.983
4.74%
1 jan 2009 ano
45.042
+1.223
2.79%
1 jan 2010 ano
51.689
+6.646
14.76%
1 jan 2011 ano
61.694
+10.005
19.36%
1 jan 2012 ano
65.919
+4.226
6.85%
1 jan 2013 ano
74.778
+8.859
13.44%
1 jan 2014 ano
84.914
+10.136
13.55%
Classificação de países por estatísticas atuais por anos


Comentários: