29
/pt/
pt
AIzaSyAYiBZKx7MnpbEhh9jyipgxe19OcubqV5w
April 1, 2024
36424
IBRD only
IBD
false
2
1
Combustible renewables and waste (% of total energy)
2015,2014,2013,2012,2011,2010,2009,2008,2007,2006,2005,2004,2003,2002,2001,2000,1999,1998,1997,1996,1995,1994,1993,1992,1991,1990,1989,1988,1987,1986,1985,1984,1983,1982,1981,1980,1979,1978,1977,1976,1975,1974,1973,1972,1971,1970,1969,1968,1967,1966,1965,1964,1963,1962,1961
Estas estatísticas em outros países:
AlbaniaAlgeriaAngolaArab WorldArgentinaArmeniaAustraliaAustriaAzerbaijanBahrainBangladeshBelarusBelgiumBeninBoliviaBosnia and HerzegovinaBotswanaBrazilBrunei DarussalamBulgariaCambodiaCameroonCanadaCaribbean small statesCentral Europe and the BalticsChileChinaColombiaCongo, Dem. Rep.Congo, Rep.Costa RicaCote d'IvoireCroatiaCubaCuracaoCyprusCzech RepublicDenmarkDominican RepublicEarly-demographic dividendEast Asia & PacificEast Asia & Pacific (excluding high income)East Asia & Pacific (IDA & IBRD countries)EcuadorEgypt, Arab Rep.El SalvadorEritreaEstoniaEthiopiaEuro areaEurope & Central AsiaEurope & Central Asia (excluding high income)Europe & Central Asia (IDA & IBRD countries)European UnionFinlandFragile and conflict affected situationsFranceGabonGeorgiaGermanyGhanaGibraltarGreeceGuatemalaHaitiHeavily indebted poor countries (HIPC)High incomeHondurasHong Kong SAR, ChinaHungaryIBRD onlyIcelandIDA & IBRD totalIDA blendIDA onlyIDA totalIndiaIndonesiaIran, Islamic Rep.IraqIrelandIsraelItalyJamaicaJapanJordanKazakhstanKenyaKorea, Dem. People’s Rep.Korea, Rep.KosovoKuwaitKyrgyz RepublicLate-demographic dividendLatin America & Caribbean Latin America & Caribbean (excluding high income)Latin America & the Caribbean (IDA & IBRD countries)LatviaLeast developed countries: UN classificationLebanonLibyaLithuaniaLow & middle incomeLow incomeLower middle incomeLuxembourgMacedonia, FYRMalaysiaMaltaMauritiusMexicoMiddle East & North AfricaMiddle East & North Africa (excluding high income)Middle East & North Africa (IDA & IBRD countries)Middle incomeMoldovaMongoliaMontenegroMoroccoMozambiqueMyanmarNamibiaNepalNetherlandsNew ZealandNicaraguaNigerNigeriaNorth AmericaNorwayOECD membersOmanOther small statesPakistanPanamaParaguayPeruPhilippinesPolandPortugalPost-demographic dividendPre-demographic dividendQatarRomaniaRussian FederationSaudi ArabiaSenegalSerbiaSingaporeSlovak RepublicSloveniaSmall statesSouth AfricaSouth AsiaSouth Asia (IDA & IBRD)South SudanSpainSri LankaSub-Saharan Africa Sub-Saharan Africa (excluding high income)Sub-Saharan Africa (IDA & IBRD countries)SudanSwedenSwitzerlandSyrian Arab RepublicTajikistanTanzaniaThailandTogoTrinidad and TobagoTunisiaTurkeyTurkmenistanUkraineUnited Arab EmiratesUnited KingdomUnited StatesUpper middle incomeUruguayUzbekistanVenezuela, RBVietnamWorldYemen, Rep.ZambiaZimbabwe Linha do tempo:
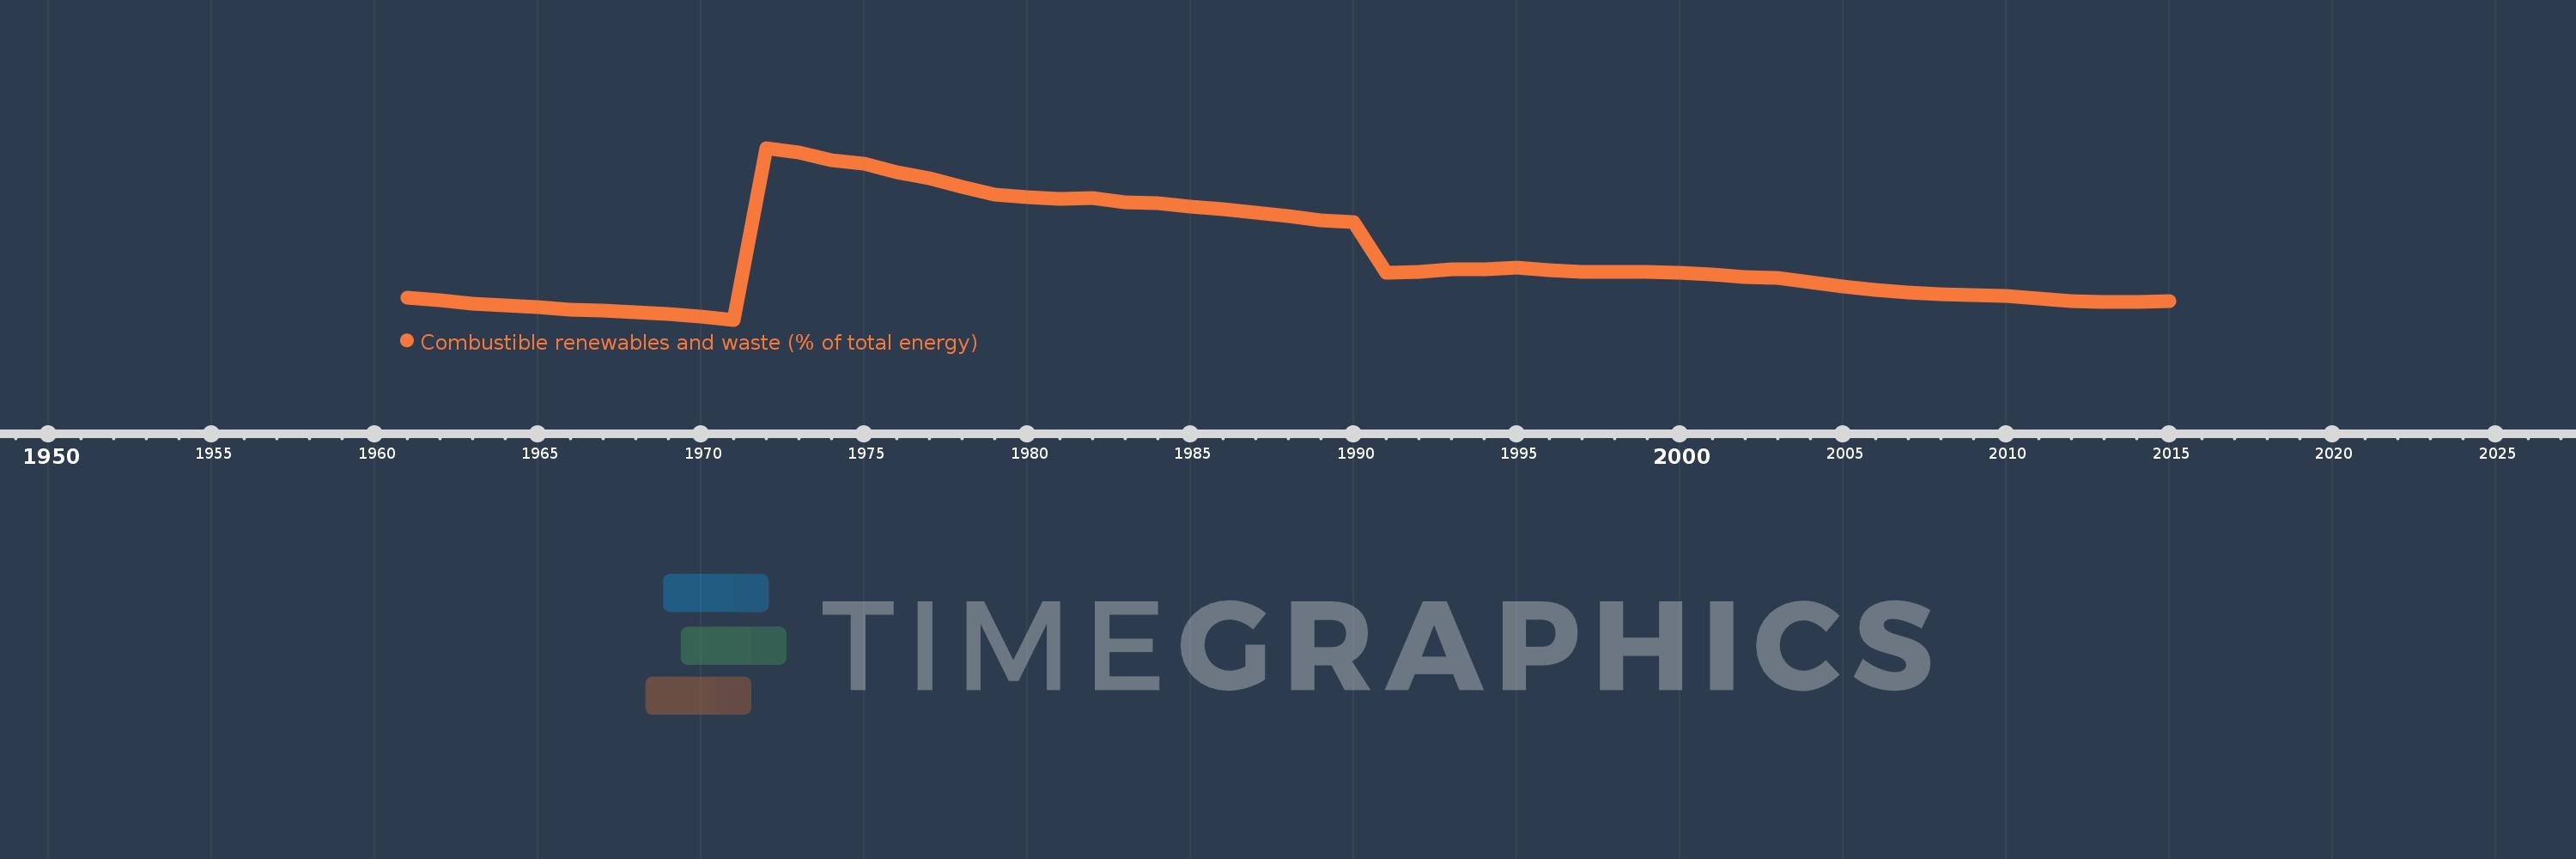
Nesta escala de tempo está apresentado um gráfico de 1961 ano até 2015 ano IBRD only. Dados de 1960 ano ausente. O número de observações reais por data: 55.
Fonte (nome):
Indicadores de desenvolvimento mundial
Fonte (organização):
IEA Statistics © OECD/IEA 2014 (http://www.iea.org/stats/index.asp), subject to https://www.iea.org/t&c/termsandconditions/
Categorias:
Energy & Mining
Foi atualizado:
23 abr 2017 ano
Indicadores de alterações dos valores ao longo dos anos
Mínimo:
6.946
1 jan 1971 ano
Máximo:
34.355
1 jan 1972 ano
Na data de observação
Valor
Mudança absoluta
A alteração em relação ao valor anterior
1 jan 1961 ano
10.404
+10.404
0.0%
1 jan 1962 ano
10.109
-0.294
-2.83%
1 jan 1963 ano
9.532
-0.577
-5.71%
1 jan 1964 ano
9.197
-0.335
-3.52%
1 jan 1965 ano
8.929
-0.268
-2.91%
1 jan 1966 ano
8.593
-0.336
-3.76%
1 jan 1967 ano
8.405
-0.188
-2.19%
1 jan 1968 ano
8.192
-0.213
-2.54%
1 jan 1969 ano
7.837
-0.355
-4.34%
1 jan 1970 ano
7.436
-0.4
-5.11%
1 jan 1971 ano
6.946
-0.49
-6.59%
1 jan 1972 ano
34.355
+27.408
394.57%
1 jan 1973 ano
33.592
-0.763
-2.22%
1 jan 1974 ano
32.429
-1.162
-3.46%
1 jan 1975 ano
31.81
-0.62
-1.91%
1 jan 1976 ano
30.492
-1.318
-4.14%
1 jan 1977 ano
29.507
-0.984
-3.23%
1 jan 1978 ano
28.208
-1.299
-4.4%
1 jan 1979 ano
26.906
-1.302
-4.62%
1 jan 1980 ano
26.466
-0.439
-1.63%
1 jan 1981 ano
26.23
-0.236
-0.89%
1 jan 1982 ano
26.319
+0.088
0.34%
1 jan 1983 ano
25.719
-0.599
-2.28%
1 jan 1984 ano
25.533
-0.186
-0.72%
1 jan 1985 ano
25.017
-0.516
-2.02%
1 jan 1986 ano
24.563
-0.454
-1.81%
1 jan 1987 ano
24.016
-0.547
-2.23%
1 jan 1988 ano
23.422
-0.594
-2.47%
1 jan 1989 ano
22.771
-0.651
-2.78%
1 jan 1990 ano
22.571
-0.201
-0.88%
1 jan 1991 ano
14.459
-8.112
-35.94%
1 jan 1992 ano
14.638
+0.179
1.24%
1 jan 1993 ano
15.031
+0.393
2.68%
1 jan 1994 ano
15.044
+0.013
0.09%
1 jan 1995 ano
15.244
+0.201
1.33%
1 jan 1996 ano
14.841
-0.403
-2.64%
1 jan 1997 ano
14.631
-0.211
-1.42%
1 jan 1998 ano
14.561
-0.07
-0.48%
1 jan 1999 ano
14.591
+0.029
0.2%
1 jan 2000 ano
14.451
-0.14
-0.96%
1 jan 2001 ano
14.12
-0.331
-2.29%
1 jan 2002 ano
13.822
-0.297
-2.11%
1 jan 2003 ano
13.556
-0.266
-1.93%
1 jan 2004 ano
12.904
-0.652
-4.81%
1 jan 2005 ano
12.233
-0.671
-5.2%
1 jan 2006 ano
11.758
-0.474
-3.88%
1 jan 2007 ano
11.319
-0.44
-3.74%
1 jan 2008 ano
11.033
-0.285
-2.52%
1 jan 2009 ano
10.911
-0.122
-1.11%
1 jan 2010 ano
10.785
-0.126
-1.16%
1 jan 2011 ano
10.353
-0.432
-4.0%
1 jan 2012 ano
9.94
-0.413
-3.99%
1 jan 2013 ano
9.823
-0.117
-1.17%
1 jan 2014 ano
9.835
+0.011
0.12%
1 jan 2015 ano
9.88
+0.045
0.46%
Classificação de países por estatísticas atuais por anos


Comentários: