29
/pt/
pt
AIzaSyAYiBZKx7MnpbEhh9jyipgxe19OcubqV5w
April 1, 2024
152331
Hungary
HUN
true
2
1
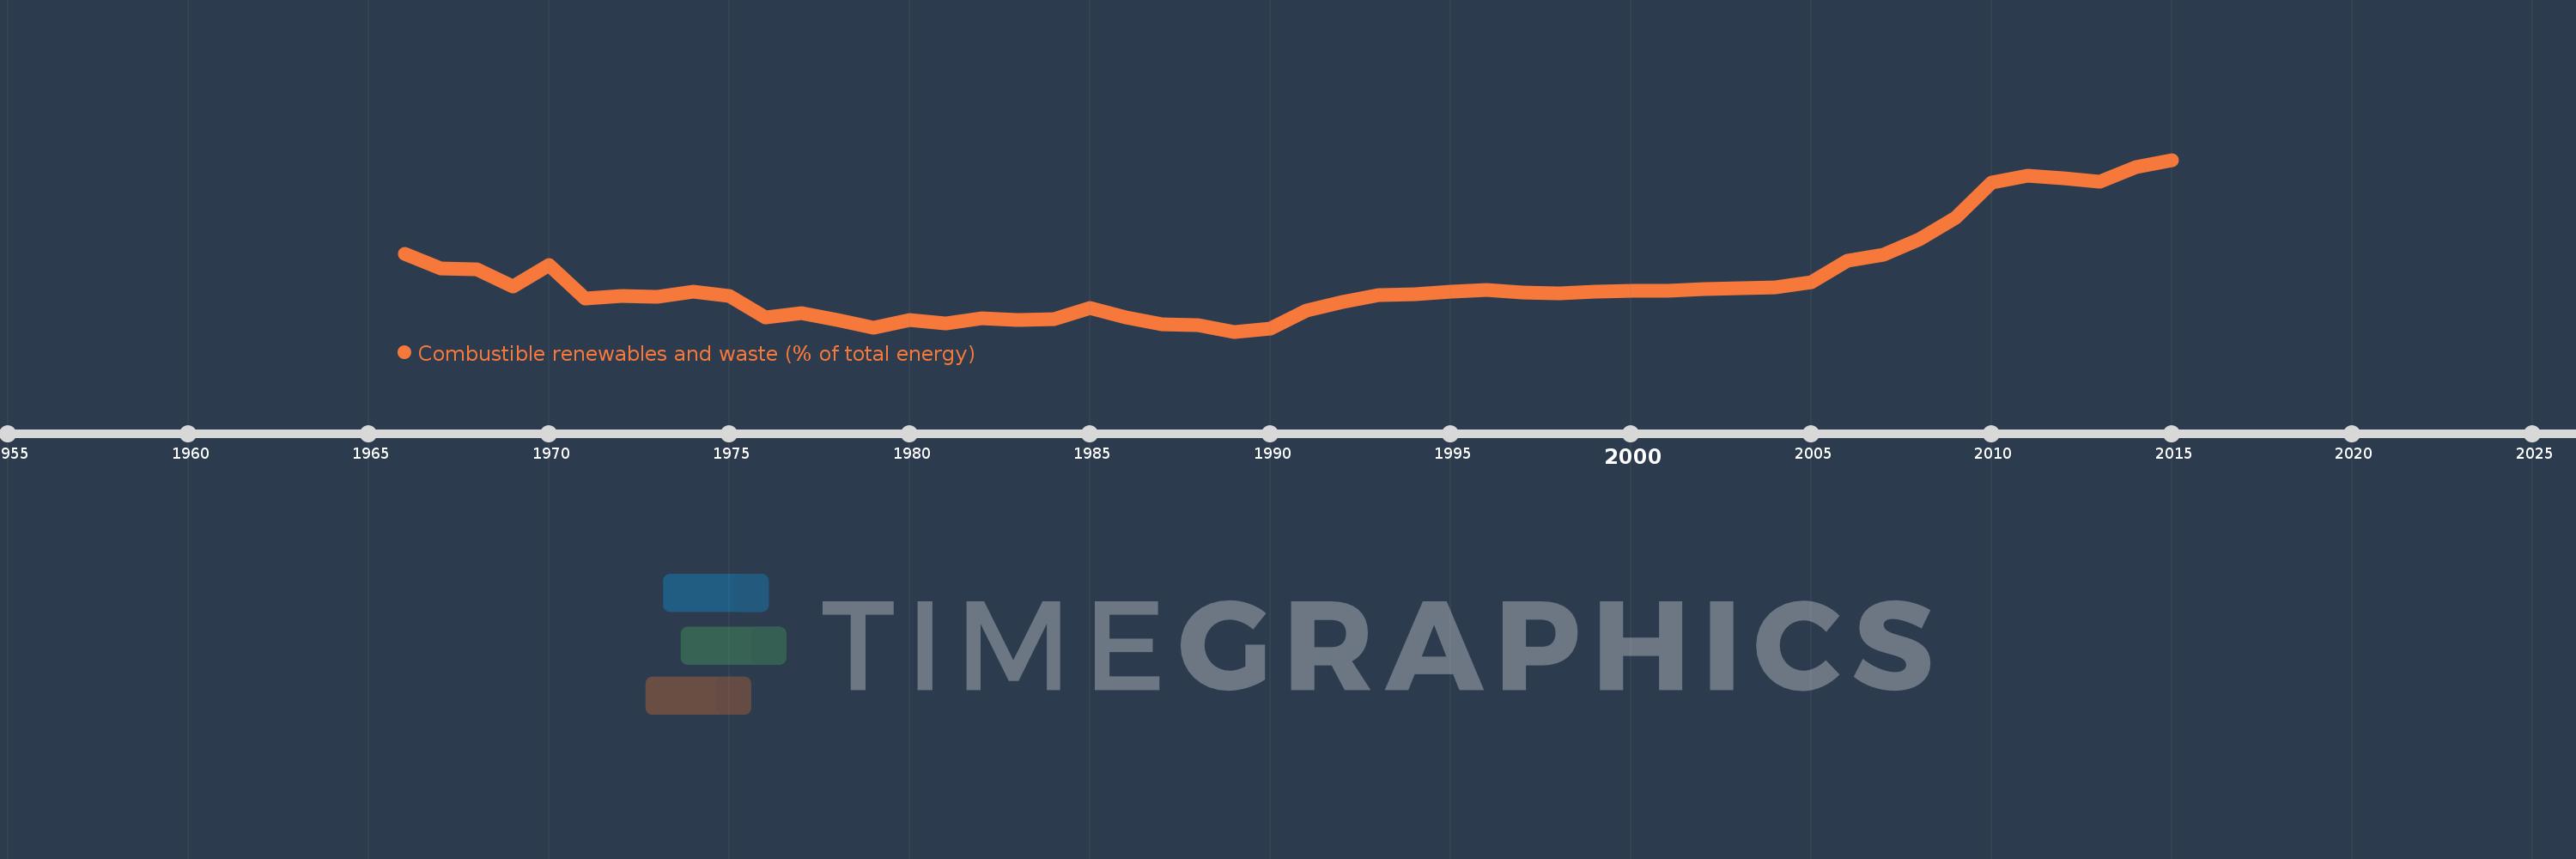
Combustible renewables and waste (% of total energy)
2015,2014,2013,2012,2011,2010,2009,2008,2007,2006,2005,2004,2003,2002,2001,2000,1999,1998,1997,1996,1995,1994,1993,1992,1991,1990,1989,1988,1987,1986,1985,1984,1983,1982,1981,1980,1979,1978,1977,1976,1975,1974,1973,1972,1971,1970,1969,1968,1967,1966
Estas estatísticas em outros países:
AlbaniaAlgeriaAngolaArab WorldArgentinaArmeniaAustraliaAustriaAzerbaijanBahrainBangladeshBelarusBelgiumBeninBoliviaBosnia and HerzegovinaBotswanaBrazilBrunei DarussalamBulgariaCambodiaCameroonCanadaCaribbean small statesCentral Europe and the BalticsChileChinaColombiaCongo, Dem. Rep.Congo, Rep.Costa RicaCote d'IvoireCroatiaCubaCuracaoCyprusCzech RepublicDenmarkDominican RepublicEarly-demographic dividendEast Asia & PacificEast Asia & Pacific (excluding high income)East Asia & Pacific (IDA & IBRD countries)EcuadorEgypt, Arab Rep.El SalvadorEritreaEstoniaEthiopiaEuro areaEurope & Central AsiaEurope & Central Asia (excluding high income)Europe & Central Asia (IDA & IBRD countries)European UnionFinlandFragile and conflict affected situationsFranceGabonGeorgiaGermanyGhanaGibraltarGreeceGuatemalaHaitiHeavily indebted poor countries (HIPC)High incomeHondurasHong Kong SAR, ChinaHungaryIBRD onlyIcelandIDA & IBRD totalIDA blendIDA onlyIDA totalIndiaIndonesiaIran, Islamic Rep.IraqIrelandIsraelItalyJamaicaJapanJordanKazakhstanKenyaKorea, Dem. People’s Rep.Korea, Rep.KosovoKuwaitKyrgyz RepublicLate-demographic dividendLatin America & Caribbean Latin America & Caribbean (excluding high income)Latin America & the Caribbean (IDA & IBRD countries)LatviaLeast developed countries: UN classificationLebanonLibyaLithuaniaLow & middle incomeLow incomeLower middle incomeLuxembourgMacedonia, FYRMalaysiaMaltaMauritiusMexicoMiddle East & North AfricaMiddle East & North Africa (excluding high income)Middle East & North Africa (IDA & IBRD countries)Middle incomeMoldovaMongoliaMontenegroMoroccoMozambiqueMyanmarNamibiaNepalNetherlandsNew ZealandNicaraguaNigerNigeriaNorth AmericaNorwayOECD membersOmanOther small statesPakistanPanamaParaguayPeruPhilippinesPolandPortugalPost-demographic dividendPre-demographic dividendQatarRomaniaRussian FederationSaudi ArabiaSenegalSerbiaSingaporeSlovak RepublicSloveniaSmall statesSouth AfricaSouth AsiaSouth Asia (IDA & IBRD)South SudanSpainSri LankaSub-Saharan Africa Sub-Saharan Africa (excluding high income)Sub-Saharan Africa (IDA & IBRD countries)SudanSwedenSwitzerlandSyrian Arab RepublicTajikistanTanzaniaThailandTogoTrinidad and TobagoTunisiaTurkeyTurkmenistanUkraineUnited Arab EmiratesUnited KingdomUnited StatesUpper middle incomeUruguayUzbekistanVenezuela, RBVietnamWorldYemen, Rep.ZambiaZimbabwe Linha do tempo:
Nesta escala de tempo está apresentado um gráfico de 1966 ano até 2015 ano Hungary. Dados de 1965 ano ausente. O número de observações reais por data: 50.
Fonte (nome):
Indicadores de desenvolvimento mundial
Fonte (organização):
IEA Statistics © OECD/IEA 2014 (http://www.iea.org/stats/index.asp), subject to https://www.iea.org/t&c/termsandconditions/
Categorias:
Energy & Mining
Foi atualizado:
23 abr 2017 ano
Indicadores de alterações dos valores ao longo dos anos
Mínimo:
1.507
1 jan 1989 ano
Máximo:
7.916
1 jan 2015 ano
Na data de observação
Valor
Mudança absoluta
A alteração em relação ao valor anterior
1 jan 1966 ano
4.42
+4.42
0.0%
1 jan 1967 ano
3.859
-0.561
-12.69%
1 jan 1968 ano
3.837
-0.022
-0.58%
1 jan 1969 ano
3.174
-0.663
-17.27%
1 jan 1970 ano
3.981
+0.807
25.43%
1 jan 1971 ano
2.752
-1.229
-30.87%
1 jan 1972 ano
2.847
+0.094
3.43%
1 jan 1973 ano
2.81
-0.037
-1.28%
1 jan 1974 ano
3.007
+0.197
7.01%
1 jan 1975 ano
2.827
-0.18
-5.99%
1 jan 1976 ano
2.031
-0.796
-28.16%
1 jan 1977 ano
2.208
+0.177
8.72%
1 jan 1978 ano
1.95
-0.258
-11.66%
1 jan 1979 ano
1.644
-0.306
-15.69%
1 jan 1980 ano
1.935
+0.29
17.64%
1 jan 1981 ano
1.818
-0.116
-6.01%
1 jan 1982 ano
2.008
+0.19
10.44%
1 jan 1983 ano
1.943
-0.065
-3.24%
1 jan 1984 ano
1.974
+0.031
1.61%
1 jan 1985 ano
2.38
+0.406
20.54%
1 jan 1986 ano
2.044
-0.336
-14.12%
1 jan 1987 ano
1.771
-0.273
-13.37%
1 jan 1988 ano
1.734
-0.036
-2.05%
1 jan 1989 ano
1.507
-0.227
-13.1%
1 jan 1990 ano
1.635
+0.128
8.52%
1 jan 1991 ano
2.281
+0.645
39.44%
1 jan 1992 ano
2.601
+0.32
14.05%
1 jan 1993 ano
2.874
+0.273
10.49%
1 jan 1994 ano
2.892
+0.018
0.63%
1 jan 1995 ano
3.011
+0.119
4.12%
1 jan 1996 ano
3.072
+0.061
2.03%
1 jan 1997 ano
2.95
-0.123
-4.0%
1 jan 1998 ano
2.939
-0.011
-0.36%
1 jan 1999 ano
2.982
+0.043
1.46%
1 jan 2000 ano
3.024
+0.043
1.43%
1 jan 2001 ano
3.032
+0.007
0.24%
1 jan 2002 ano
3.109
+0.077
2.53%
1 jan 2003 ano
3.111
+0.003
0.08%
1 jan 2004 ano
3.145
+0.034
1.08%
1 jan 2005 ano
3.34
+0.196
6.22%
1 jan 2006 ano
4.155
+0.815
24.4%
1 jan 2007 ano
4.386
+0.231
5.55%
1 jan 2008 ano
4.951
+0.565
12.89%
1 jan 2009 ano
5.757
+0.806
16.28%
1 jan 2010 ano
7.08
+1.323
22.98%
1 jan 2011 ano
7.308
+0.229
3.23%
1 jan 2012 ano
7.225
-0.084
-1.15%
1 jan 2013 ano
7.106
-0.119
-1.64%
1 jan 2014 ano
7.631
+0.525
7.39%
1 jan 2015 ano
7.916
+0.284
3.72%
Classificação de países por estatísticas atuais por anos


Comentários: