29
/pt/
pt
AIzaSyAYiBZKx7MnpbEhh9jyipgxe19OcubqV5w
April 1, 2024
35167
Heavily indebted poor countries (HIPC)
HPC
false
2
1
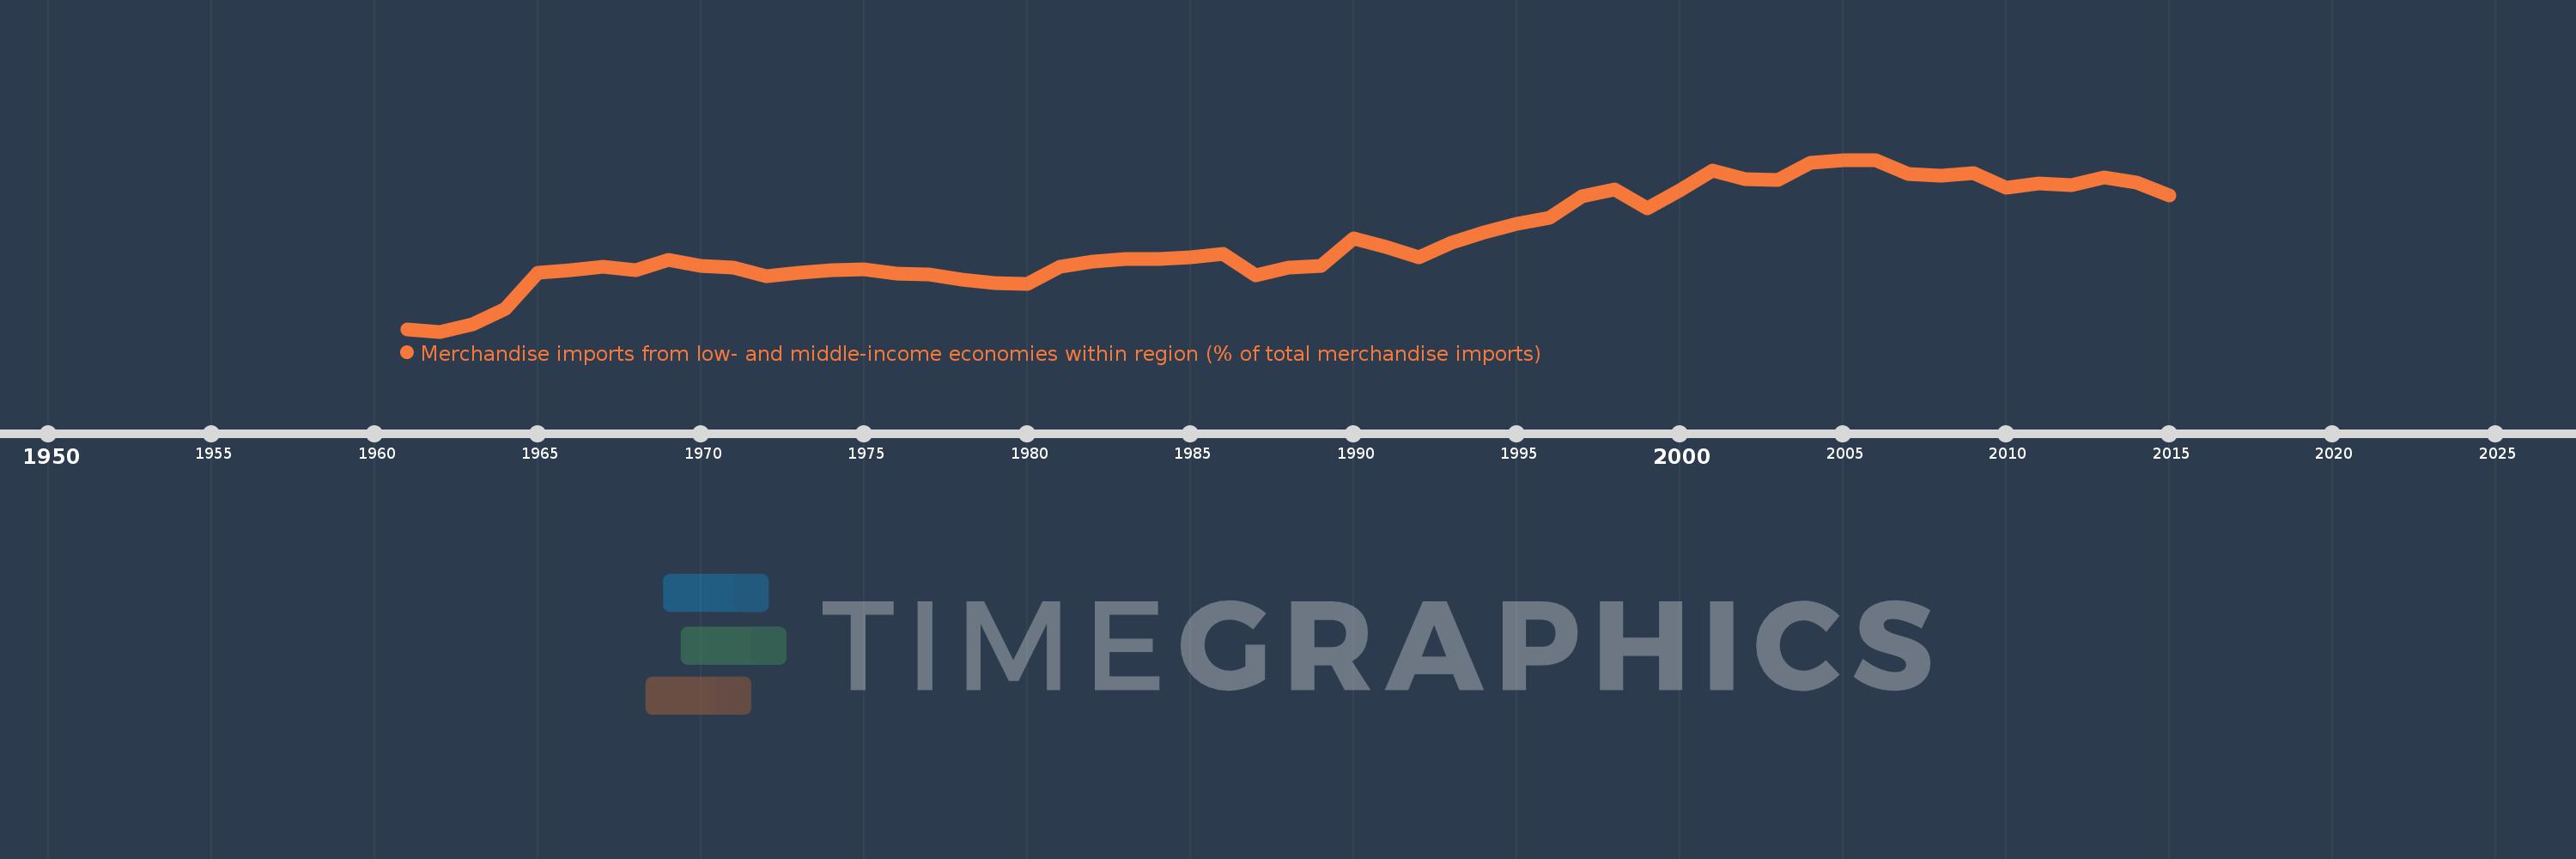
Merchandise imports from low- and middle-income economies within region (% of total merchandise imports)
2015,2014,2013,2012,2011,2010,2009,2008,2007,2006,2005,2004,2003,2002,2001,2000,1999,1998,1997,1996,1995,1994,1993,1992,1991,1990,1989,1988,1987,1986,1985,1984,1983,1982,1981,1980,1979,1978,1977,1976,1975,1974,1973,1972,1971,1970,1969,1968,1967,1966,1965,1964,1963,1962,1961
Estas estatísticas em outros países:
Linha do tempo:
Nesta escala de tempo está apresentado um gráfico de 1961 ano até 2015 ano Heavily indebted poor countries (HIPC). Dados de 1960 ano ausente. O número de observações reais por data: 55.
Fonte (nome):
Indicadores de desenvolvimento mundial
Fonte (organização):
World Bank staff estimates based data from International Monetary Fund's Direction of Trade database.
Categorias:
Private Sector, Trade
Foi atualizado:
23 abr 2017 ano
Indicadores de alterações dos valores ao longo dos anos
Mínimo:
4.065
1 jan 1962 ano
Máximo:
23.349
1 jan 2006 ano
Na data de observação
Valor
Mudança absoluta
A alteração em relação ao valor anterior
1 jan 1961 ano
4.288
+4.288
0.0%
1 jan 1962 ano
4.065
-0.223
-5.2%
1 jan 1963 ano
4.898
+0.833
20.49%
1 jan 1964 ano
6.659
+1.761
35.96%
1 jan 1965 ano
10.696
+4.037
60.63%
1 jan 1966 ano
10.995
+0.299
2.8%
1 jan 1967 ano
11.302
+0.308
2.8%
1 jan 1968 ano
10.926
-0.376
-3.33%
1 jan 1969 ano
12.155
+1.229
11.25%
1 jan 1970 ano
11.445
-0.71
-5.84%
1 jan 1971 ano
11.242
-0.203
-1.77%
1 jan 1972 ano
10.286
-0.956
-8.51%
1 jan 1973 ano
10.677
+0.391
3.8%
1 jan 1974 ano
10.912
+0.235
2.2%
1 jan 1975 ano
11.076
+0.164
1.5%
1 jan 1976 ano
10.546
-0.53
-4.78%
1 jan 1977 ano
10.459
-0.087
-0.83%
1 jan 1978 ano
9.9
-0.559
-5.35%
1 jan 1979 ano
9.486
-0.414
-4.18%
1 jan 1980 ano
9.404
-0.082
-0.86%
1 jan 1981 ano
11.305
+1.901
20.22%
1 jan 1982 ano
11.971
+0.666
5.89%
1 jan 1983 ano
12.187
+0.216
1.81%
1 jan 1984 ano
12.224
+0.036
0.3%
1 jan 1985 ano
12.368
+0.144
1.18%
1 jan 1986 ano
12.798
+0.431
3.48%
1 jan 1987 ano
10.424
-2.374
-18.55%
1 jan 1988 ano
11.258
+0.834
8.0%
1 jan 1989 ano
11.448
+0.19
1.68%
1 jan 1990 ano
14.52
+3.073
26.84%
1 jan 1991 ano
13.535
-0.985
-6.78%
1 jan 1992 ano
12.418
-1.117
-8.26%
1 jan 1993 ano
14.022
+1.604
12.92%
1 jan 1994 ano
15.245
+1.223
8.72%
1 jan 1995 ano
16.159
+0.914
5.99%
1 jan 1996 ano
16.819
+0.66
4.09%
1 jan 1997 ano
19.27
+2.451
14.57%
1 jan 1998 ano
20.005
+0.735
3.82%
1 jan 1999 ano
17.875
-2.13
-10.65%
1 jan 2000 ano
19.922
+2.047
11.45%
1 jan 2001 ano
22.135
+2.213
11.11%
1 jan 2002 ano
21.161
-0.973
-4.4%
1 jan 2003 ano
21.101
-0.061
-0.29%
1 jan 2004 ano
23.038
+1.937
9.18%
1 jan 2005 ano
23.34
+0.303
1.31%
1 jan 2006 ano
23.349
+0.009
0.04%
1 jan 2007 ano
21.793
-1.556
-6.66%
1 jan 2008 ano
21.523
-0.27
-1.24%
1 jan 2009 ano
21.892
+0.369
1.71%
1 jan 2010 ano
20.19
-1.702
-7.77%
1 jan 2011 ano
20.705
+0.515
2.55%
1 jan 2012 ano
20.508
-0.196
-0.95%
1 jan 2013 ano
21.388
+0.88
4.29%
1 jan 2014 ano
20.788
-0.6
-2.81%
1 jan 2015 ano
19.379
-1.409
-6.78%
Classificação de países por estatísticas atuais por anos


Comentários: