30
/pt/
AIzaSyAYiBZKx7MnpbEhh9jyipgxe19OcubqV5w
April 1, 2024
200655
Montenegro
MNE
true
2
1
Merchandise imports from low- and middle-income economies within region (% of total merchandise imports)
2015,2014,2013,2012,2011,2010,2009,2008,2007,2006
Download
Biblioteca de estatísticas globais →Montenegro →

Merchandise imports from low- and middle-income economies within region (% of total merchandise imports)

Estas estatísticas em outros países:

AfghanistanAlbaniaAlgeriaAngolaArab WorldArmeniaAzerbaijanBangladeshBelarusBelizeBeninBoliviaBosnia and HerzegovinaBrazilBulgariaBurkina FasoBurundiCabo VerdeCambodiaCameroonCaribbean small statesCentral African RepublicCentral Europe and the BalticsChadChinaColombiaCongo, Dem. Rep.Congo, Rep.Costa RicaCote d'IvoireCubaDjiboutiDominicaDominican RepublicEarly-demographic dividendEast Asia & PacificEast Asia & Pacific (excluding high income)East Asia & Pacific (IDA & IBRD countries)EcuadorEgypt, Arab Rep.El SalvadorEthiopiaEurope & Central AsiaEurope & Central Asia (excluding high income)Europe & Central Asia (IDA & IBRD countries)European UnionFijiFragile and conflict affected situationsGabonGambia, TheGeorgiaGhanaGrenadaGuatemalaGuineaGuinea-BissauGuyanaHaitiHeavily indebted poor countries (HIPC)HondurasIBRD onlyIDA & IBRD totalIDA blendIDA onlyIDA totalIndiaIndonesiaIran, Islamic Rep.IraqJamaicaJordanKazakhstanKenyaKorea, Dem. People’s Rep.Kyrgyz RepublicLao PDRLate-demographic dividendLatin America & Caribbean Latin America & Caribbean (excluding high income)Latin America & the Caribbean (IDA & IBRD countries)Least developed countries: UN classificationLebanonLiberiaLibyaLow & middle incomeLow incomeLower middle incomeMacedonia, FYRMadagascarMalawiMalaysiaMaldivesMaliMauritaniaMauritiusMexicoMiddle East & North AfricaMiddle East & North Africa (excluding high income)Middle East & North Africa (IDA & IBRD countries)Middle incomeMoldovaMongoliaMontenegroMoroccoMozambiqueMyanmarNepalNicaraguaNigerNigeriaOECD membersOther small statesPacific island small statesPakistanPanamaPapua New GuineaParaguayPeruPhilippinesPost-demographic dividendPre-demographic dividendRomaniaRwandaSamoaSenegalSerbiaSierra LeoneSmall statesSolomon IslandsSomaliaSouth AfricaSouth AsiaSouth Asia (IDA & IBRD)Sri LankaSt. LuciaSt. Vincent and the GrenadinesSub-Saharan Africa Sub-Saharan Africa (excluding high income)Sub-Saharan Africa (IDA & IBRD countries)SudanSurinameSyrian Arab RepublicTajikistanTanzaniaThailandTogoTongaTunisiaTurkeyTurkmenistanUgandaUkraineUpper middle incomeUzbekistanVanuatuVietnamWorldYemen, Rep.ZambiaZimbabwe

Linha do tempo:

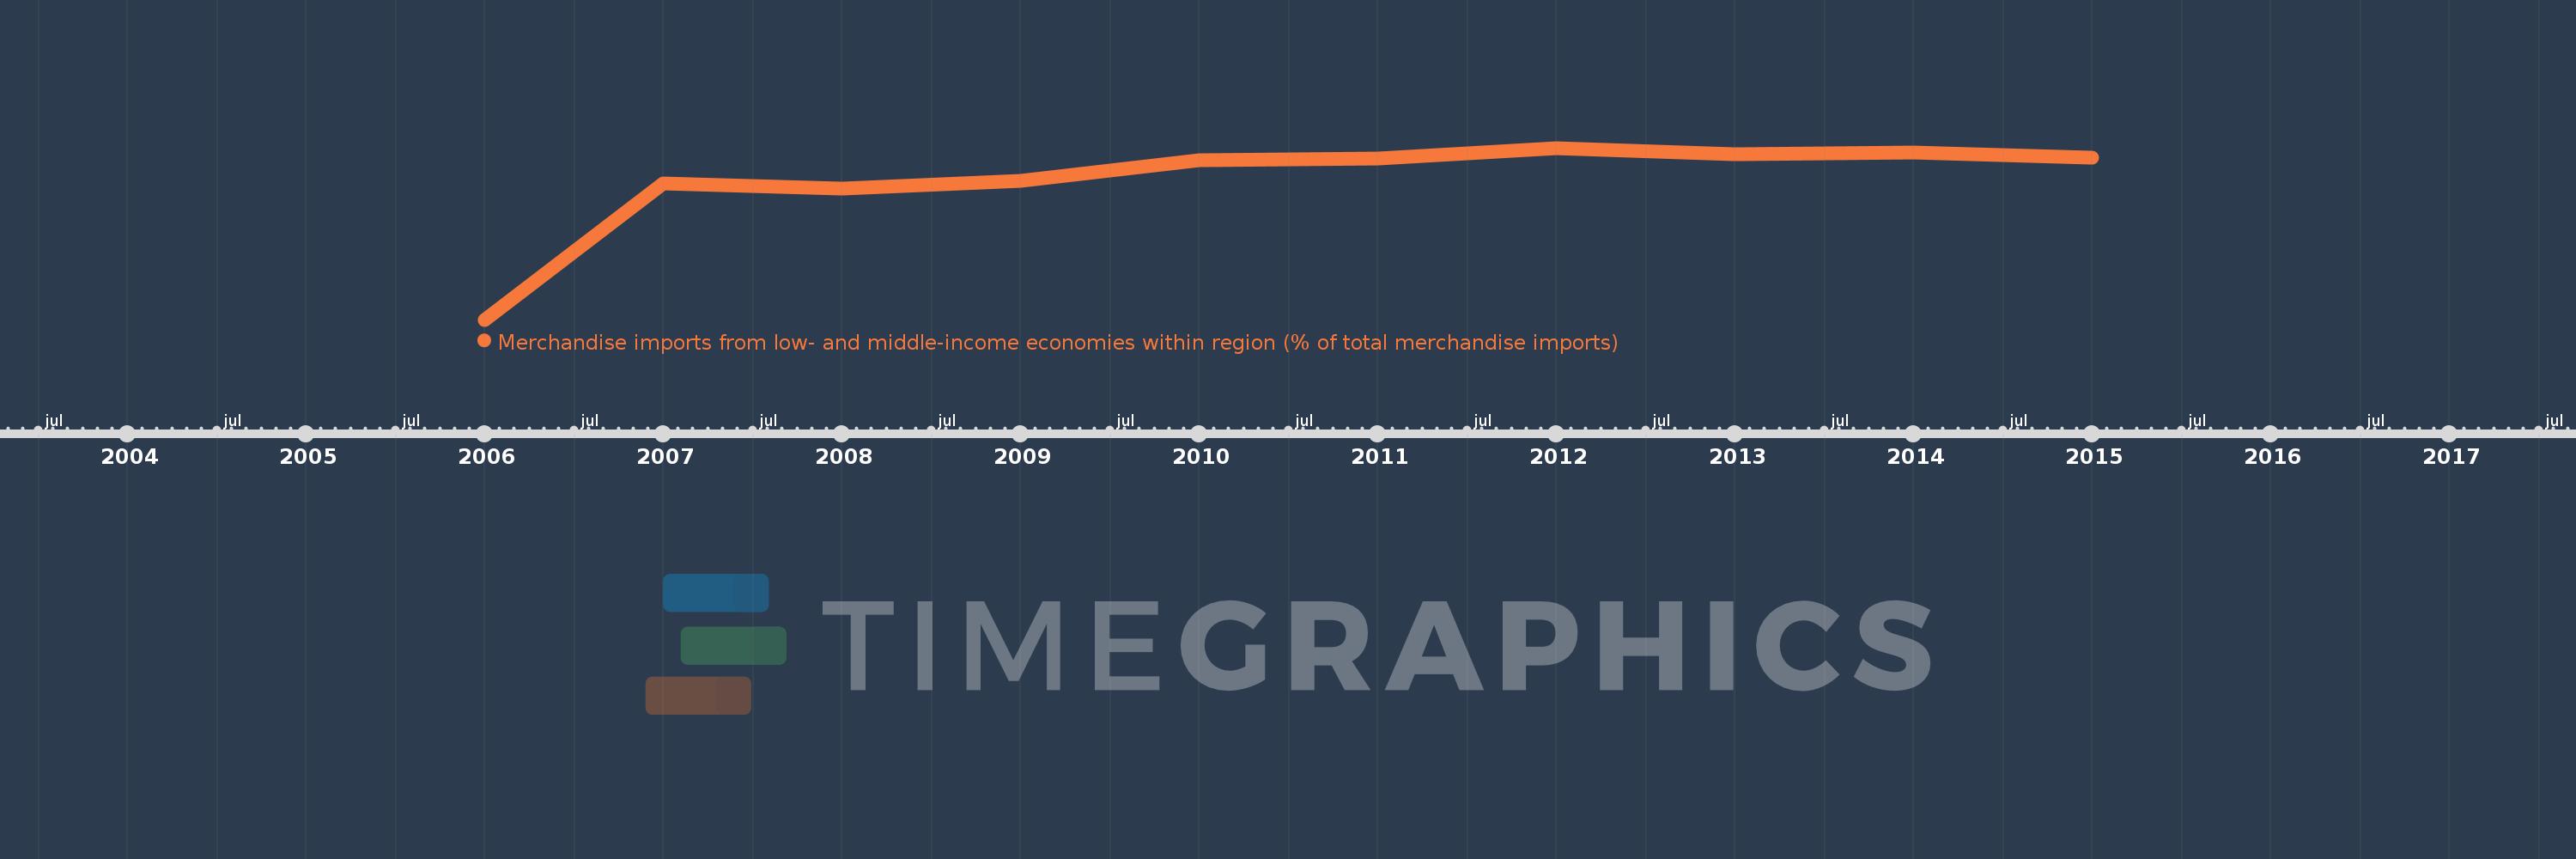
Nesta escala de tempo está apresentado um gráfico de 2006 ano até 2015 ano Montenegro. Dados de 2005 ano ausente. O número de observações reais por data: 10.

Fonte (nome):

Indicadores de desenvolvimento mundial

Fonte (organização):

World Bank staff estimates based data from International Monetary Fund's Direction of Trade database.

Categorias:

Private Sector, Trade

Foi atualizado:

23 abr 2017 ano

Indicadores de alterações dos valores ao longo dos anos

Em média:
34.229
Mínimo:
0.0
1 jan 2006 ano
Máximo:
42.173
1 jan 2012 ano
Na data de observação
Valor
Mudança absoluta
A alteração em relação ao valor anterior
1 jan 2006 ano
0.0
0.0
0.0%
1 jan 2007 ano
33.491
+33.491
%
1 jan 2008 ano
32.219
-1.272
-3.8%
1 jan 2009 ano
34.002
+1.783
5.53%
1 jan 2010 ano
39.179
+5.177
15.22%
1 jan 2011 ano
39.678
+0.5
1.28%
1 jan 2012 ano
42.173
+2.495
6.29%
1 jan 2013 ano
40.699
-1.475
-3.5%
1 jan 2014 ano
40.977
+0.278
0.68%
1 jan 2015 ano
39.873
-1.103
-2.69%

Classificação de países por estatísticas atuais por anos