29
/pt/
pt
AIzaSyAYiBZKx7MnpbEhh9jyipgxe19OcubqV5w
April 1, 2024
34261
Fragile and conflict affected situations
FCS
false
2
1
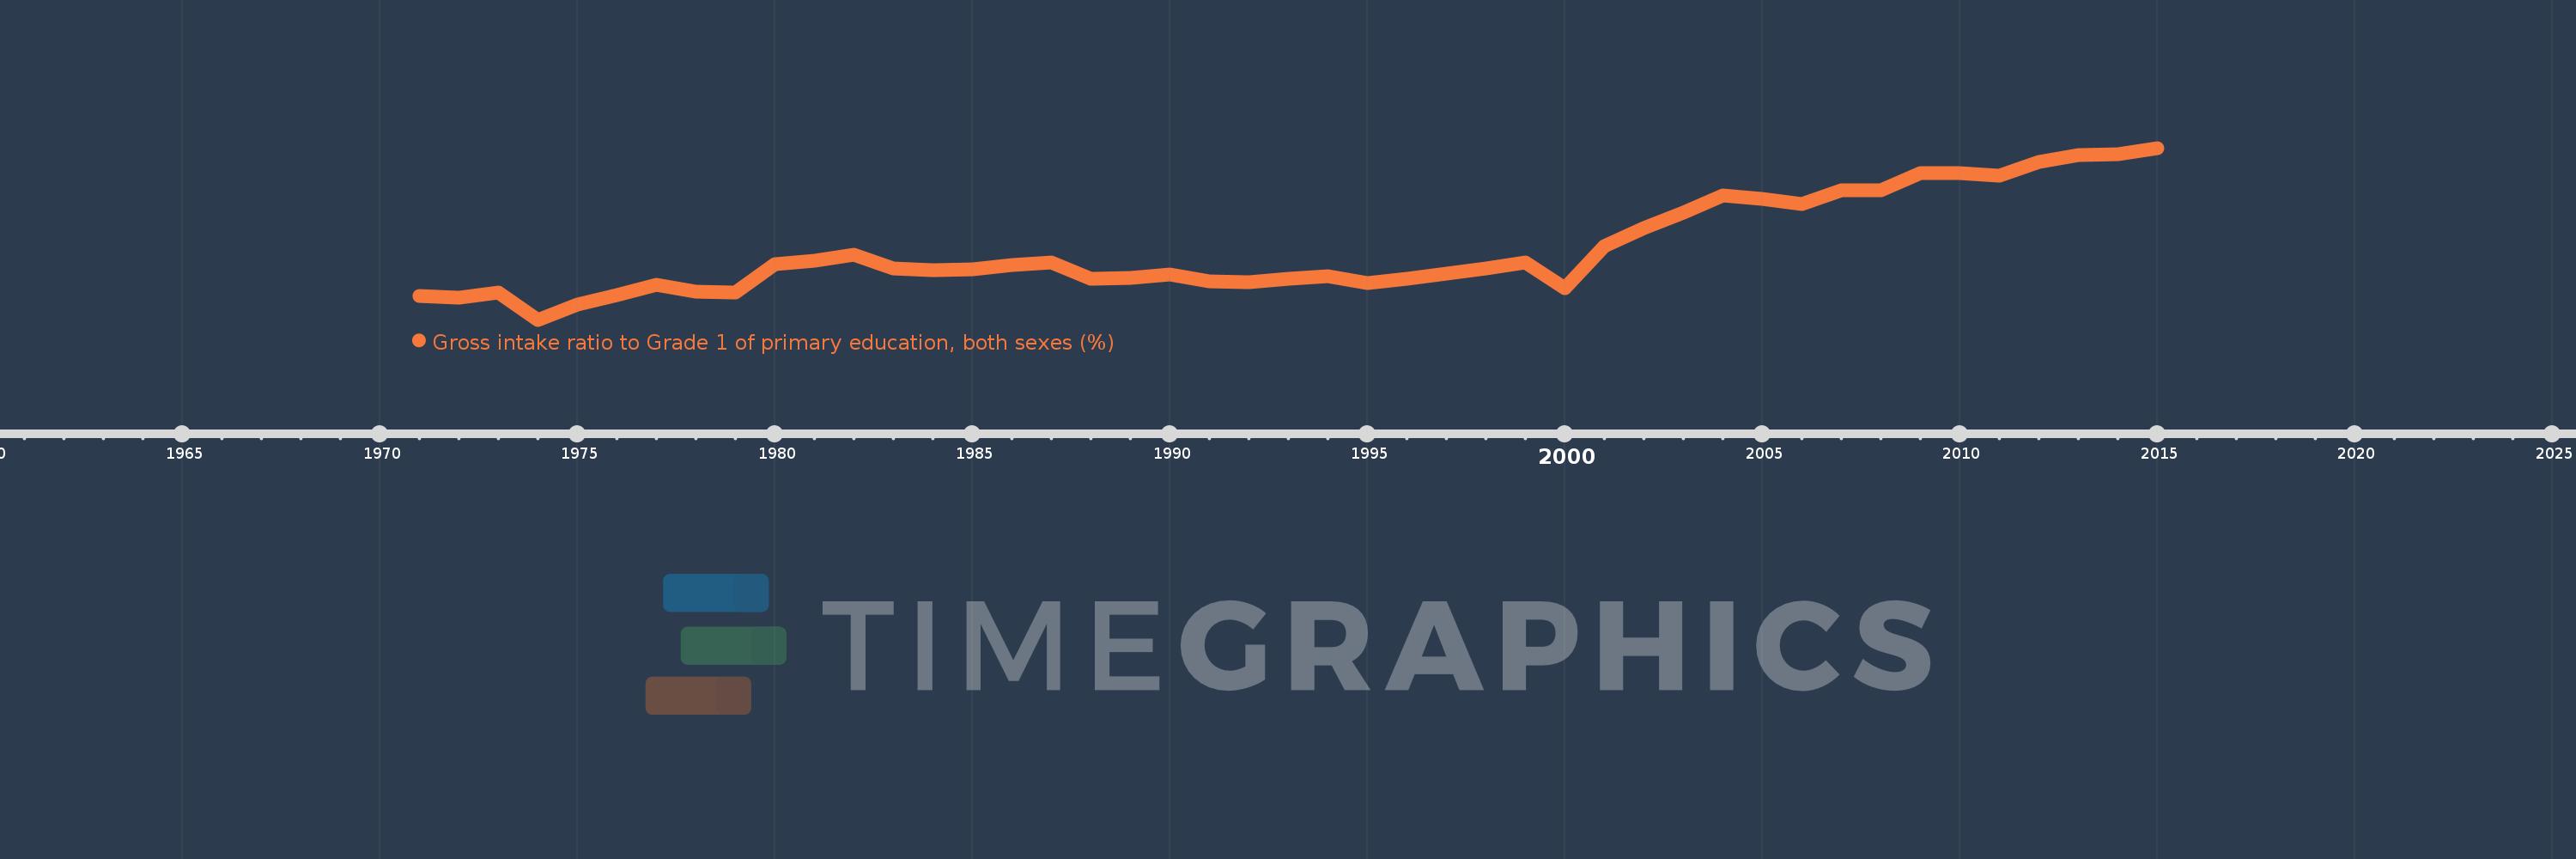
Gross intake ratio to Grade 1 of primary education, both sexes (%)
2015,2014,2013,2012,2011,2010,2009,2008,2007,2006,2005,2004,2003,2002,2001,2000,1999,1998,1997,1996,1995,1994,1993,1992,1991,1990,1989,1988,1987,1986,1985,1984,1983,1982,1981,1980,1979,1978,1977,1976,1975,1974,1973,1972,1971
Estas estatísticas em outros países:
AfghanistanAlbaniaAlgeriaAngolaAntigua and BarbudaArab WorldArgentinaArmeniaArubaAustriaAzerbaijanBahamas, TheBahrainBangladeshBarbadosBelarusBelgiumBelizeBeninBermudaBhutanBoliviaBosnia and HerzegovinaBotswanaBrazilBritish Virgin IslandsBrunei DarussalamBulgariaBurkina FasoBurundiCabo VerdeCambodiaCameroonCanadaCaribbean small statesCentral African RepublicCentral Europe and the BalticsChadChileChinaColombiaComorosCongo, Dem. Rep.Congo, Rep.Costa RicaCote d'IvoireCroatiaCubaCyprusCzech RepublicDenmarkDjiboutiDominicaDominican RepublicEarly-demographic dividendEast Asia & PacificEast Asia & Pacific (excluding high income)East Asia & Pacific (IDA & IBRD countries)EcuadorEgypt, Arab Rep.El SalvadorEquatorial GuineaEritreaEstoniaEthiopiaEuro areaEurope & Central AsiaEurope & Central Asia (excluding high income)Europe & Central Asia (IDA & IBRD countries)European UnionFijiFinlandFragile and conflict affected situationsFranceGabonGambia, TheGeorgiaGermanyGhanaGreeceGrenadaGuatemalaGuineaGuinea-BissauGuyanaHaitiHeavily indebted poor countries (HIPC)High incomeHondurasHong Kong SAR, ChinaHungaryIBRD onlyIcelandIDA & IBRD totalIDA blendIDA onlyIDA totalIndiaIndonesiaIran, Islamic Rep.IraqIrelandIsraelItalyJamaicaJapanJordanKazakhstanKenyaKiribatiKorea, Dem. People’s Rep.Korea, Rep.KuwaitKyrgyz RepublicLao PDRLate-demographic dividendLatin America & Caribbean Latin America & Caribbean (excluding high income)Latin America & the Caribbean (IDA & IBRD countries)LatviaLeast developed countries: UN classificationLebanonLesothoLiberiaLibyaLiechtensteinLithuaniaLow & middle incomeLow incomeLower middle incomeLuxembourgMacao SAR, ChinaMacedonia, FYRMadagascarMalawiMalaysiaMaldivesMaliMaltaMarshall IslandsMauritaniaMauritiusMexicoMicronesia, Fed. Sts.Middle East & North AfricaMiddle East & North Africa (excluding high income)Middle East & North Africa (IDA & IBRD countries)Middle incomeMoldovaMongoliaMontenegroMoroccoMozambiqueMyanmarNamibiaNauruNepalNetherlandsNew ZealandNicaraguaNigerNigeriaNorth AmericaNorwayOECD membersOmanOther small statesPacific island small statesPakistanPalauPanamaPapua New GuineaParaguayPeruPhilippinesPolandPortugalPost-demographic dividendPre-demographic dividendPuerto RicoQatarRomaniaRussian FederationRwandaSamoaSan MarinoSao Tome and PrincipeSaudi ArabiaSenegalSerbiaSeychellesSierra LeoneSlovak RepublicSloveniaSmall statesSolomon IslandsSouth AfricaSouth AsiaSouth Asia (IDA & IBRD)South SudanSpainSri LankaSt. Kitts and NevisSt. LuciaSt. Vincent and the GrenadinesSub-Saharan Africa Sub-Saharan Africa (excluding high income)Sub-Saharan Africa (IDA & IBRD countries)SudanSurinameSwazilandSwedenSwitzerlandSyrian Arab RepublicTajikistanTanzaniaThailandTimor-LesteTogoTongaTrinidad and TobagoTunisiaTurkeyTuvaluUgandaUkraineUnited Arab EmiratesUnited StatesUpper middle incomeUruguayUzbekistanVanuatuVenezuela, RBVietnamWest Bank and GazaWorldYemen, Rep.ZambiaZimbabwe Linha do tempo:
Nesta escala de tempo está apresentado um gráfico de 1971 ano até 2015 ano Fragile and conflict affected situations. Dados de 1970 ano ausente. O número de observações reais por data: 45.
Fonte (nome):
Indicadores de desenvolvimento mundial
Fonte (organização):
UNESCO Institute for Statistics
Categorias:
Education
Foi atualizado:
23 abr 2017 ano
Indicadores de alterações dos valores ao longo dos anos
Mínimo:
75.155
1 jan 1974 ano
Máximo:
114.181
1 jan 2015 ano
Na data de observação
Valor
Mudança absoluta
A alteração em relação ao valor anterior
1 jan 1971 ano
80.511
+80.511
0.0%
1 jan 1972 ano
80.267
-0.244
-0.3%
1 jan 1973 ano
81.403
+1.136
1.42%
1 jan 1974 ano
75.155
-6.249
-7.68%
1 jan 1975 ano
78.529
+3.375
4.49%
1 jan 1976 ano
80.683
+2.153
2.74%
1 jan 1977 ano
83.04
+2.357
2.92%
1 jan 1978 ano
81.601
-1.439
-1.73%
1 jan 1979 ano
81.379
-0.222
-0.27%
1 jan 1980 ano
87.794
+6.415
7.88%
1 jan 1981 ano
88.639
+0.845
0.96%
1 jan 1982 ano
89.994
+1.355
1.53%
1 jan 1983 ano
86.872
-3.122
-3.47%
1 jan 1984 ano
86.405
-0.467
-0.54%
1 jan 1985 ano
86.674
+0.269
0.31%
1 jan 1986 ano
87.566
+0.892
1.03%
1 jan 1987 ano
88.116
+0.55
0.63%
1 jan 1988 ano
84.464
-3.652
-4.14%
1 jan 1989 ano
84.66
+0.197
0.23%
1 jan 1990 ano
85.463
+0.802
0.95%
1 jan 1991 ano
83.903
-1.559
-1.82%
1 jan 1992 ano
83.647
-0.257
-0.31%
1 jan 1993 ano
84.388
+0.741
0.89%
1 jan 1994 ano
85.016
+0.628
0.74%
1 jan 1995 ano
83.442
-1.574
-1.85%
1 jan 1996 ano
84.402
+0.96
1.15%
1 jan 1997 ano
85.726
+1.324
1.57%
1 jan 1998 ano
86.741
+1.015
1.18%
1 jan 1999 ano
88.126
+1.385
1.6%
1 jan 2000 ano
82.397
-5.729
-6.5%
1 jan 2001 ano
91.86
+9.463
11.48%
1 jan 2002 ano
95.891
+4.031
4.39%
1 jan 2003 ano
99.52
+3.629
3.78%
1 jan 2004 ano
103.464
+3.944
3.96%
1 jan 2005 ano
102.566
-0.898
-0.87%
1 jan 2006 ano
101.443
-1.123
-1.09%
1 jan 2007 ano
104.493
+3.05
3.01%
1 jan 2008 ano
104.62
+0.127
0.12%
1 jan 2009 ano
108.422
+3.802
3.63%
1 jan 2010 ano
108.468
+0.046
0.04%
1 jan 2011 ano
107.967
-0.501
-0.46%
1 jan 2012 ano
111.083
+3.117
2.89%
1 jan 2013 ano
112.534
+1.45
1.31%
1 jan 2014 ano
112.789
+0.256
0.23%
1 jan 2015 ano
114.181
+1.391
1.23%
Classificação de países por estatísticas atuais por anos


Comentários: