29
/pt/
pt
AIzaSyAYiBZKx7MnpbEhh9jyipgxe19OcubqV5w
April 1, 2024
191467
Malta
MLT
true
2
1
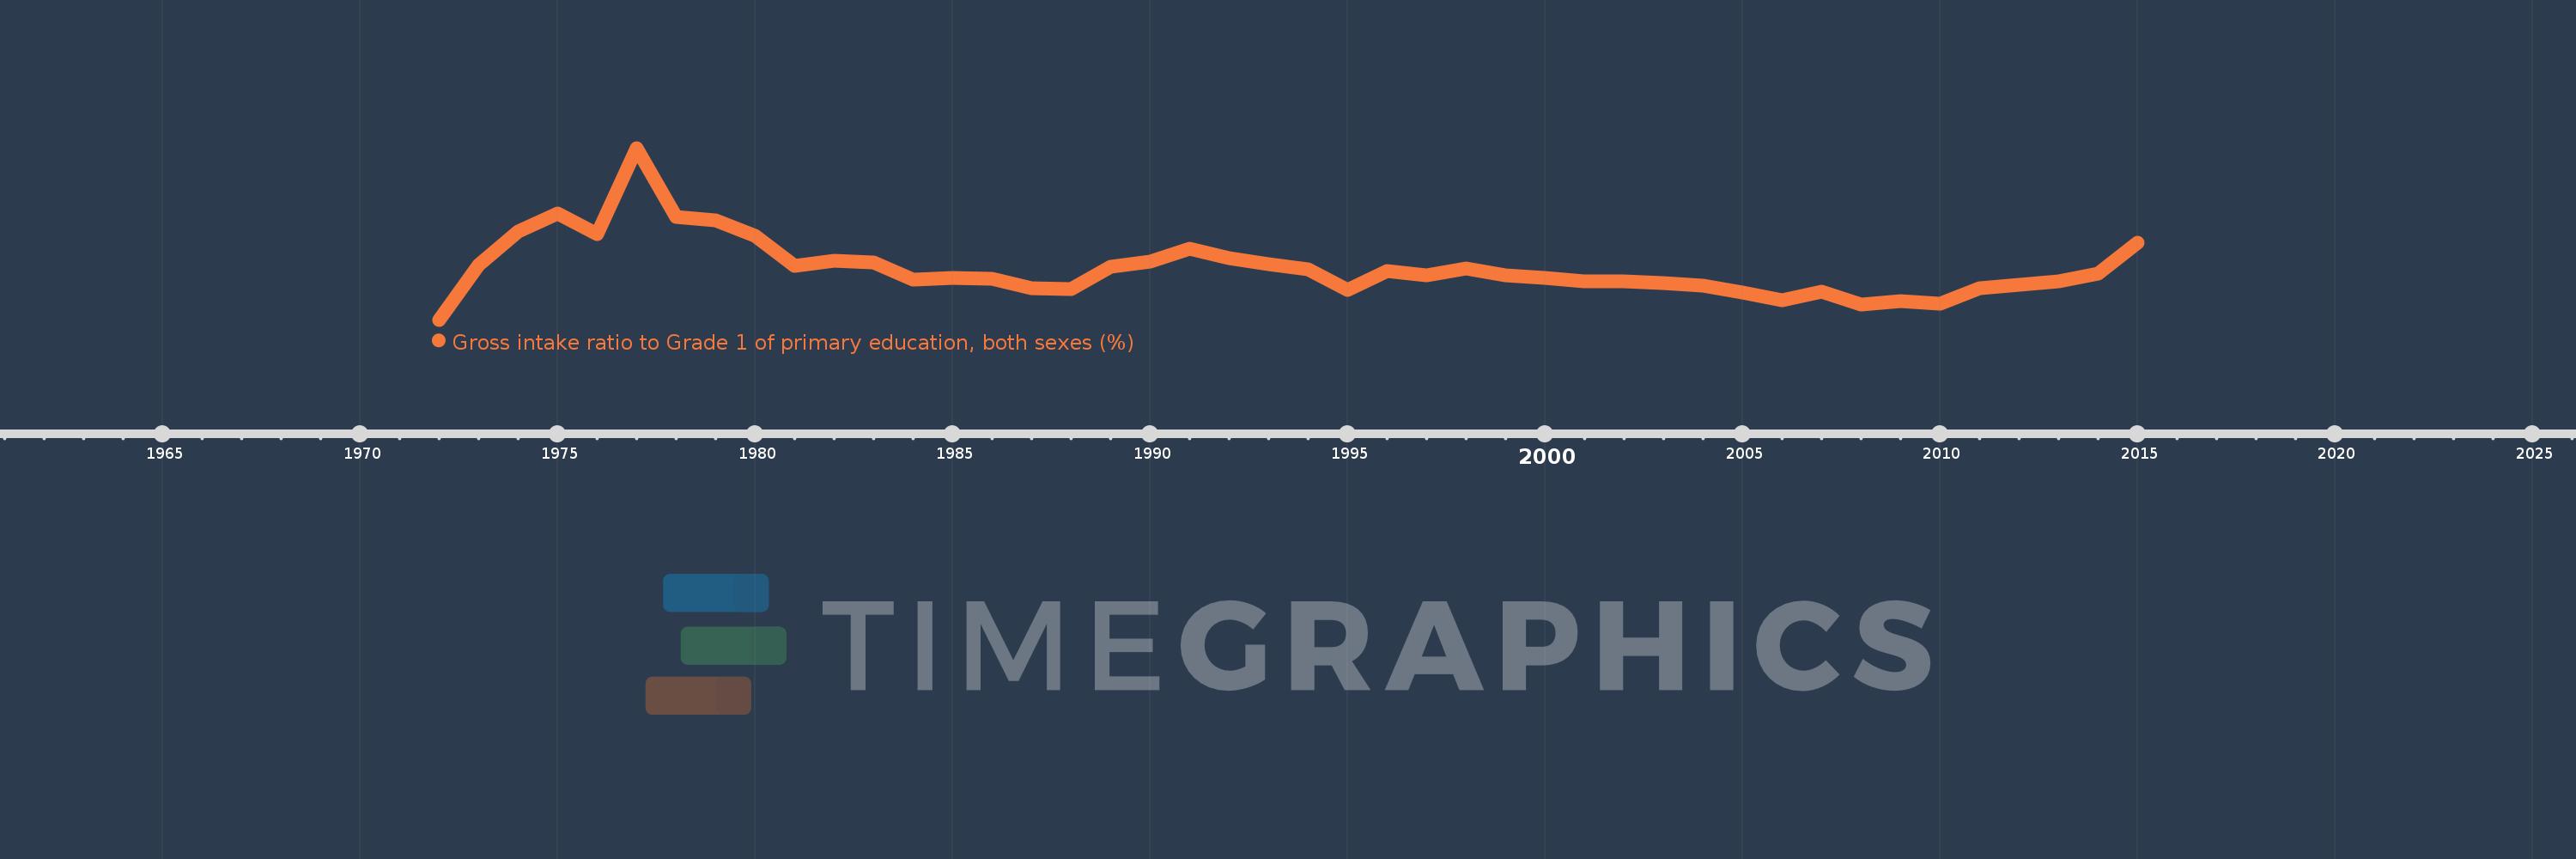
Gross intake ratio to Grade 1 of primary education, both sexes (%)
2015,2014,2013,2012,2011,2010,2009,2008,2007,2006,2005,2004,2003,2002,2001,2000,1999,1998,1997,1996,1995,1994,1993,1992,1991,1990,1989,1988,1987,1986,1985,1984,1983,1982,1981,1980,1979,1978,1977,1976,1975,1974,1973,1972
Estas estatísticas em outros países:
AfghanistanAlbaniaAlgeriaAngolaAntigua and BarbudaArab WorldArgentinaArmeniaArubaAustriaAzerbaijanBahamas, TheBahrainBangladeshBarbadosBelarusBelgiumBelizeBeninBermudaBhutanBoliviaBosnia and HerzegovinaBotswanaBrazilBritish Virgin IslandsBrunei DarussalamBulgariaBurkina FasoBurundiCabo VerdeCambodiaCameroonCanadaCaribbean small statesCentral African RepublicCentral Europe and the BalticsChadChileChinaColombiaComorosCongo, Dem. Rep.Congo, Rep.Costa RicaCote d'IvoireCroatiaCubaCyprusCzech RepublicDenmarkDjiboutiDominicaDominican RepublicEarly-demographic dividendEast Asia & PacificEast Asia & Pacific (excluding high income)East Asia & Pacific (IDA & IBRD countries)EcuadorEgypt, Arab Rep.El SalvadorEquatorial GuineaEritreaEstoniaEthiopiaEuro areaEurope & Central AsiaEurope & Central Asia (excluding high income)Europe & Central Asia (IDA & IBRD countries)European UnionFijiFinlandFragile and conflict affected situationsFranceGabonGambia, TheGeorgiaGermanyGhanaGreeceGrenadaGuatemalaGuineaGuinea-BissauGuyanaHaitiHeavily indebted poor countries (HIPC)High incomeHondurasHong Kong SAR, ChinaHungaryIBRD onlyIcelandIDA & IBRD totalIDA blendIDA onlyIDA totalIndiaIndonesiaIran, Islamic Rep.IraqIrelandIsraelItalyJamaicaJapanJordanKazakhstanKenyaKiribatiKorea, Dem. People’s Rep.Korea, Rep.KuwaitKyrgyz RepublicLao PDRLate-demographic dividendLatin America & Caribbean Latin America & Caribbean (excluding high income)Latin America & the Caribbean (IDA & IBRD countries)LatviaLeast developed countries: UN classificationLebanonLesothoLiberiaLibyaLiechtensteinLithuaniaLow & middle incomeLow incomeLower middle incomeLuxembourgMacao SAR, ChinaMacedonia, FYRMadagascarMalawiMalaysiaMaldivesMaliMaltaMarshall IslandsMauritaniaMauritiusMexicoMicronesia, Fed. Sts.Middle East & North AfricaMiddle East & North Africa (excluding high income)Middle East & North Africa (IDA & IBRD countries)Middle incomeMoldovaMongoliaMontenegroMoroccoMozambiqueMyanmarNamibiaNauruNepalNetherlandsNew ZealandNicaraguaNigerNigeriaNorth AmericaNorwayOECD membersOmanOther small statesPacific island small statesPakistanPalauPanamaPapua New GuineaParaguayPeruPhilippinesPolandPortugalPost-demographic dividendPre-demographic dividendPuerto RicoQatarRomaniaRussian FederationRwandaSamoaSan MarinoSao Tome and PrincipeSaudi ArabiaSenegalSerbiaSeychellesSierra LeoneSlovak RepublicSloveniaSmall statesSolomon IslandsSouth AfricaSouth AsiaSouth Asia (IDA & IBRD)South SudanSpainSri LankaSt. Kitts and NevisSt. LuciaSt. Vincent and the GrenadinesSub-Saharan Africa Sub-Saharan Africa (excluding high income)Sub-Saharan Africa (IDA & IBRD countries)SudanSurinameSwazilandSwedenSwitzerlandSyrian Arab RepublicTajikistanTanzaniaThailandTimor-LesteTogoTongaTrinidad and TobagoTunisiaTurkeyTuvaluUgandaUkraineUnited Arab EmiratesUnited StatesUpper middle incomeUruguayUzbekistanVanuatuVenezuela, RBVietnamWest Bank and GazaWorldYemen, Rep.ZambiaZimbabwe Linha do tempo:
Nesta escala de tempo está apresentado um gráfico de 1972 ano até 2015 ano Malta. Dados de 1971 ano ausente. O número de observações reais por data: 44.
Fonte (nome):
Indicadores de desenvolvimento mundial
Fonte (organização):
UNESCO Institute for Statistics
Categorias:
Education
Foi atualizado:
23 abr 2017 ano
Indicadores de alterações dos valores ao longo dos anos
Mínimo:
84.358
1 jan 1972 ano
Máximo:
140.678
1 jan 1977 ano
Na data de observação
Valor
Mudança absoluta
A alteração em relação ao valor anterior
1 jan 1972 ano
84.358
+84.358
0.0%
1 jan 1973 ano
102.227
+17.868
21.18%
1 jan 1974 ano
113.366
+11.139
10.9%
1 jan 1975 ano
119.094
+5.728
5.05%
1 jan 1976 ano
112.5
-6.594
-5.54%
1 jan 1977 ano
140.678
+28.178
25.05%
1 jan 1978 ano
118.047
-22.63
-16.09%
1 jan 1979 ano
116.922
-1.125
-0.95%
1 jan 1980 ano
111.751
-5.171
-4.42%
1 jan 1981 ano
101.942
-9.81
-8.78%
1 jan 1982 ano
103.797
+1.856
1.82%
1 jan 1983 ano
103.13
-0.667
-0.64%
1 jan 1984 ano
97.625
-5.505
-5.34%
1 jan 1985 ano
98.141
+0.516
0.53%
1 jan 1986 ano
97.73
-0.411
-0.42%
1 jan 1987 ano
94.572
-3.158
-3.23%
1 jan 1988 ano
94.386
-0.186
-0.2%
1 jan 1989 ano
101.829
+7.443
7.89%
1 jan 1990 ano
103.474
+1.645
1.62%
1 jan 1991 ano
107.557
+4.083
3.95%
1 jan 1992 ano
104.479
-3.078
-2.86%
1 jan 1993 ano
102.469
-2.01
-1.92%
1 jan 1994 ano
100.84
-1.628
-1.59%
1 jan 1995 ano
94.172
-6.668
-6.61%
1 jan 1996 ano
100.275
+6.103
6.48%
1 jan 1997 ano
98.79
-1.485
-1.48%
1 jan 1998 ano
101.294
+2.504
2.54%
1 jan 1999 ano
98.858
-2.436
-2.4%
1 jan 2000 ano
98.005
-0.853
-0.86%
1 jan 2001 ano
97.054
-0.952
-0.97%
1 jan 2002 ano
97.06
+0.006
0.01%
1 jan 2003 ano
96.509
-0.551
-0.57%
1 jan 2004 ano
95.408
-1.101
-1.14%
1 jan 2005 ano
93.254
-2.155
-2.26%
1 jan 2006 ano
90.689
-2.565
-2.75%
1 jan 2007 ano
93.684
+2.996
3.3%
1 jan 2008 ano
89.454
-4.231
-4.52%
1 jan 2009 ano
90.424
+0.97
1.08%
1 jan 2010 ano
89.711
-0.713
-0.79%
1 jan 2011 ano
94.677
+4.966
5.54%
1 jan 2012 ano
95.794
+1.117
1.18%
1 jan 2013 ano
96.854
+1.06
1.11%
1 jan 2014 ano
99.544
+2.69
2.78%
1 jan 2015 ano
109.498
+9.954
10.0%
Classificação de países por estatísticas atuais por anos


Comentários: