29
/pt/
pt
AIzaSyAYiBZKx7MnpbEhh9jyipgxe19OcubqV5w
April 1, 2024
33701
European Union
EUU
false
2
1
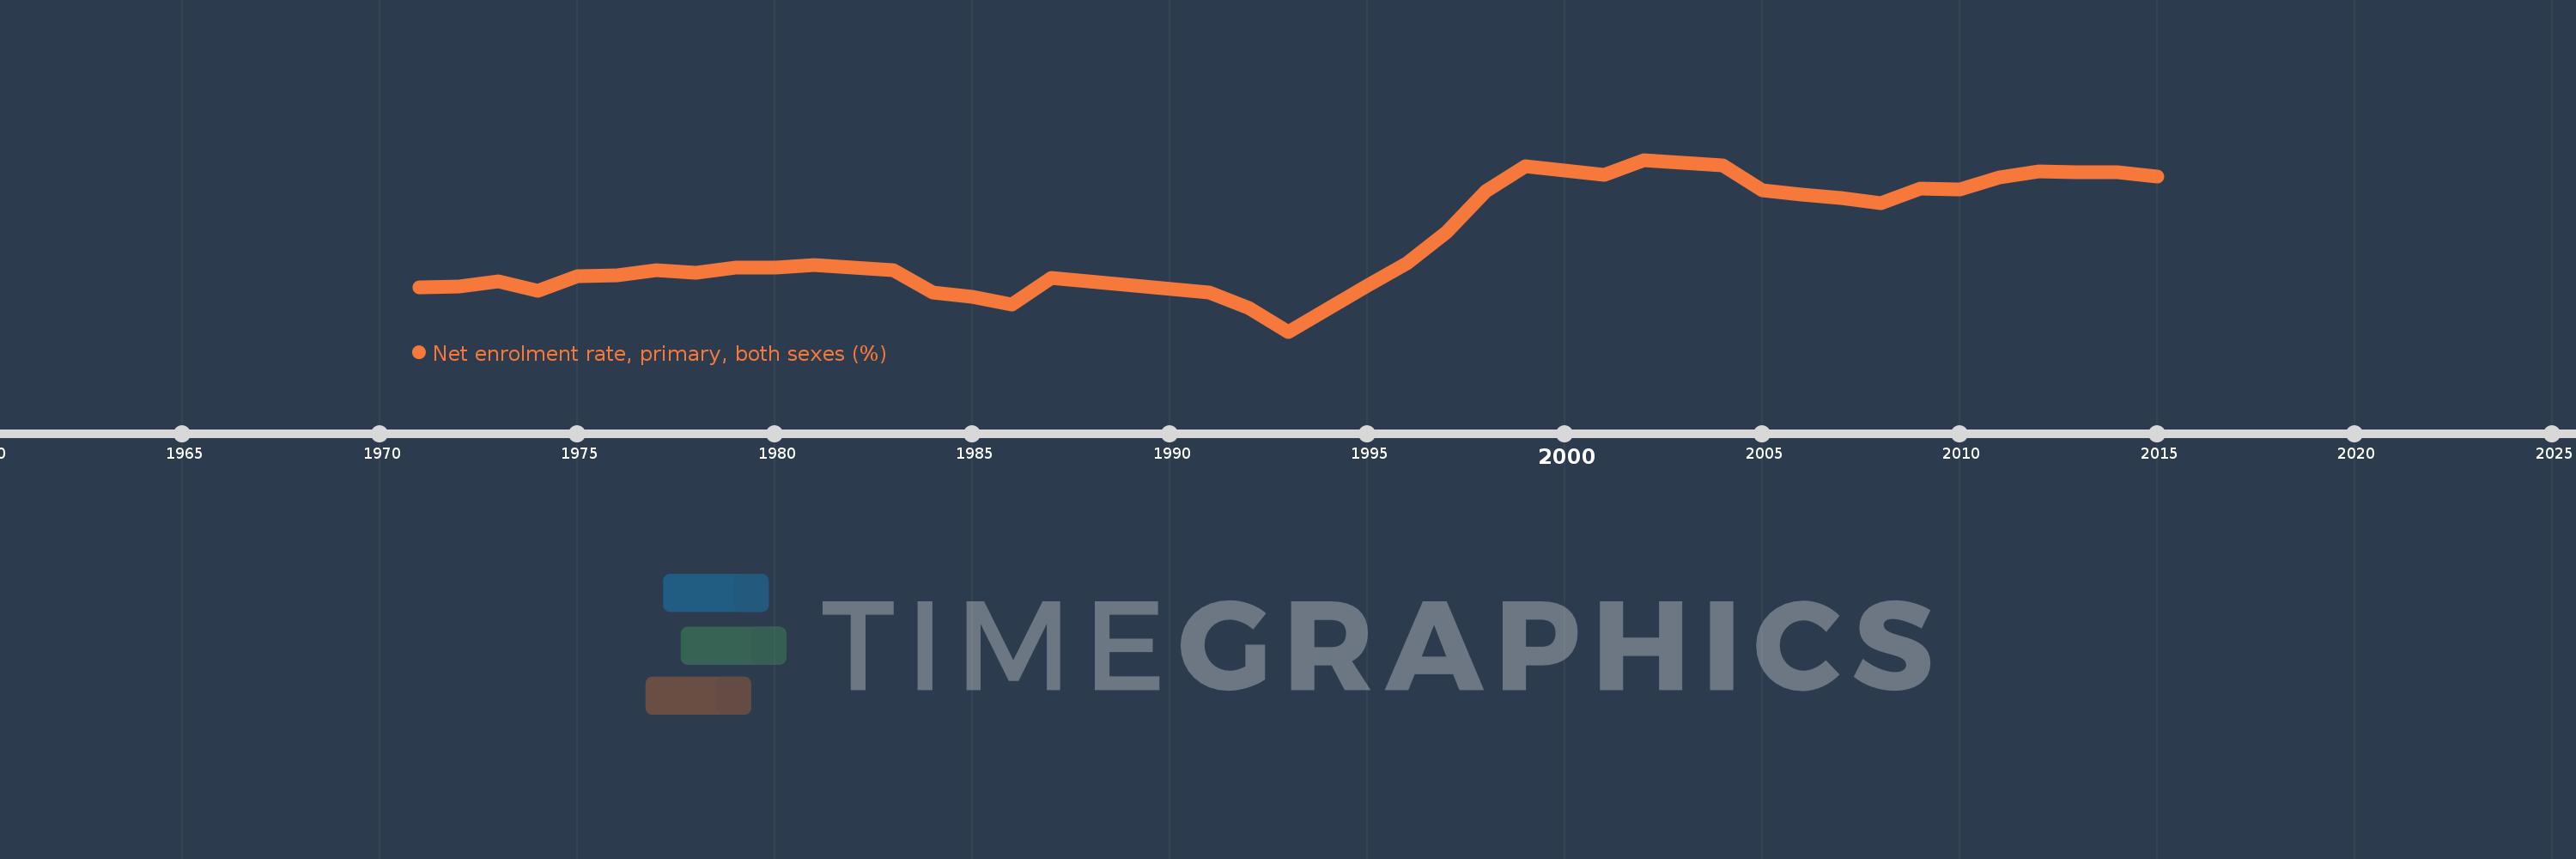
Net enrolment rate, primary, both sexes (%)
2015,2014,2013,2012,2011,2010,2009,2008,2007,2006,2005,2004,2003,2002,2001,2000,1999,1998,1997,1996,1995,1994,1993,1992,1991,1987,1986,1985,1984,1983,1982,1981,1980,1979,1978,1977,1976,1975,1974,1973,1972,1971
Estas estatísticas em outros países:
AfghanistanAlbaniaAlgeriaAngolaAntigua and BarbudaArab WorldArgentinaArmeniaArubaAustraliaAustriaAzerbaijanBahamas, TheBahrainBangladeshBarbadosBelarusBelgiumBelizeBeninBermudaBhutanBoliviaBosnia and HerzegovinaBotswanaBrazilBrunei DarussalamBulgariaBurkina FasoBurundiCabo VerdeCambodiaCameroonCanadaCaribbean small statesCentral African RepublicCentral Europe and the BalticsChadChileChinaColombiaComorosCongo, Dem. Rep.Congo, Rep.Costa RicaCote d'IvoireCroatiaCubaCyprusDenmarkDjiboutiDominicaDominican RepublicEarly-demographic dividendEast Asia & PacificEast Asia & Pacific (excluding high income)East Asia & Pacific (IDA & IBRD countries)EcuadorEgypt, Arab Rep.El SalvadorEquatorial GuineaEritreaEstoniaEthiopiaEuro areaEurope & Central AsiaEurope & Central Asia (excluding high income)Europe & Central Asia (IDA & IBRD countries)European UnionFijiFinlandFragile and conflict affected situationsFranceGabonGambia, TheGeorgiaGermanyGhanaGreeceGrenadaGuatemalaGuineaGuinea-BissauGuyanaHaitiHeavily indebted poor countries (HIPC)High incomeHondurasHong Kong SAR, ChinaHungaryIBRD onlyIcelandIDA & IBRD totalIDA blendIDA onlyIDA totalIndiaIndonesiaIran, Islamic Rep.IraqIrelandIsraelItalyJamaicaJapanJordanKazakhstanKenyaKiribatiKorea, Dem. People’s Rep.Korea, Rep.KuwaitKyrgyz RepublicLao PDRLate-demographic dividendLatin America & Caribbean Latin America & Caribbean (excluding high income)Latin America & the Caribbean (IDA & IBRD countries)LatviaLeast developed countries: UN classificationLebanonLesothoLiberiaLibyaLiechtensteinLithuaniaLow & middle incomeLow incomeLower middle incomeLuxembourgMacao SAR, ChinaMacedonia, FYRMadagascarMalawiMalaysiaMaldivesMaliMaltaMarshall IslandsMauritaniaMauritiusMexicoMicronesia, Fed. Sts.Middle East & North AfricaMiddle East & North Africa (excluding high income)Middle East & North Africa (IDA & IBRD countries)Middle incomeMoldovaMongoliaMontenegroMoroccoMozambiqueMyanmarNamibiaNauruNepalNetherlandsNew ZealandNicaraguaNigerNigeriaNorth AmericaNorwayOECD membersOmanOther small statesPacific island small statesPakistanPalauPanamaPapua New GuineaParaguayPeruPhilippinesPolandPortugalPost-demographic dividendPre-demographic dividendPuerto RicoQatarRomaniaRussian FederationRwandaSamoaSan MarinoSao Tome and PrincipeSaudi ArabiaSenegalSerbiaSeychellesSierra LeoneSloveniaSmall statesSolomon IslandsSomaliaSouth AfricaSouth AsiaSouth Asia (IDA & IBRD)South SudanSpainSri LankaSt. Kitts and NevisSt. LuciaSt. Vincent and the GrenadinesSub-Saharan Africa Sub-Saharan Africa (excluding high income)Sub-Saharan Africa (IDA & IBRD countries)SudanSurinameSwazilandSwedenSwitzerlandSyrian Arab RepublicTajikistanTanzaniaThailandTimor-LesteTogoTongaTrinidad and TobagoTunisiaTurkeyTuvaluUgandaUkraineUnited Arab EmiratesUnited KingdomUnited StatesUpper middle incomeUruguayUzbekistanVanuatuVenezuela, RBVietnamWest Bank and GazaWorldYemen, Rep.ZambiaZimbabwe Linha do tempo:
Nesta escala de tempo está apresentado um gráfico de 1971 ano até 2015 ano European Union. Dados de 1970 ano ausente. O número de observações reais por data: 42.
Fonte (nome):
Indicadores de desenvolvimento mundial
Fonte (organização):
UNESCO Institute for Statistics
Categorias:
Education
Foi atualizado:
23 abr 2017 ano
Indicadores de alterações dos valores ao longo dos anos
Mínimo:
94.604
1 jan 1993 ano
Máximo:
97.919
1 jan 2002 ano
Na data de observação
Valor
Mudança absoluta
A alteração em relação ao valor anterior
1 jan 1971 ano
95.462
+95.462
0.0%
1 jan 1972 ano
95.474
+0.012
0.01%
1 jan 1973 ano
95.568
+0.095
0.1%
1 jan 1974 ano
95.386
-0.182
-0.19%
1 jan 1975 ano
95.671
+0.285
0.3%
1 jan 1976 ano
95.689
+0.018
0.02%
1 jan 1977 ano
95.782
+0.093
0.1%
1 jan 1978 ano
95.739
-0.043
-0.05%
1 jan 1979 ano
95.836
+0.097
0.1%
1 jan 1980 ano
95.839
+0.003
0.0%
1 jan 1981 ano
95.896
+0.057
0.06%
1 jan 1982 ano
95.836
-0.061
-0.06%
1 jan 1983 ano
95.792
-0.044
-0.05%
1 jan 1984 ano
95.364
-0.428
-0.45%
1 jan 1985 ano
95.283
-0.081
-0.09%
1 jan 1986 ano
95.131
-0.152
-0.16%
1 jan 1987 ano
95.647
+0.516
0.54%
1 jan 1991 ano
95.355
-0.292
-0.31%
1 jan 1992 ano
95.054
-0.301
-0.32%
1 jan 1993 ano
94.604
-0.45
-0.47%
1 jan 1994 ano
95.041
+0.436
0.46%
1 jan 1995 ano
95.497
+0.457
0.48%
1 jan 1996 ano
95.921
+0.424
0.44%
1 jan 1997 ano
96.512
+0.592
0.62%
1 jan 1998 ano
97.319
+0.807
0.84%
1 jan 1999 ano
97.8
+0.481
0.49%
1 jan 2000 ano
97.704
-0.097
-0.1%
1 jan 2001 ano
97.627
-0.077
-0.08%
1 jan 2002 ano
97.919
+0.293
0.3%
1 jan 2003 ano
97.856
-0.064
-0.06%
1 jan 2004 ano
97.805
-0.051
-0.05%
1 jan 2005 ano
97.331
-0.473
-0.48%
1 jan 2006 ano
97.24
-0.091
-0.09%
1 jan 2007 ano
97.181
-0.059
-0.06%
1 jan 2008 ano
97.077
-0.104
-0.11%
1 jan 2009 ano
97.369
+0.293
0.3%
1 jan 2010 ano
97.353
-0.016
-0.02%
1 jan 2011 ano
97.586
+0.233
0.24%
1 jan 2012 ano
97.687
+0.101
0.1%
1 jan 2013 ano
97.684
-0.003
0.0%
1 jan 2014 ano
97.682
-0.002
0.0%
1 jan 2015 ano
97.59
-0.093
-0.09%
Classificação de países por estatísticas atuais por anos


Comentários: