29
/pt/
pt
AIzaSyAYiBZKx7MnpbEhh9jyipgxe19OcubqV5w
April 1, 2024
268356
Tunisia
TUN
true
2
1
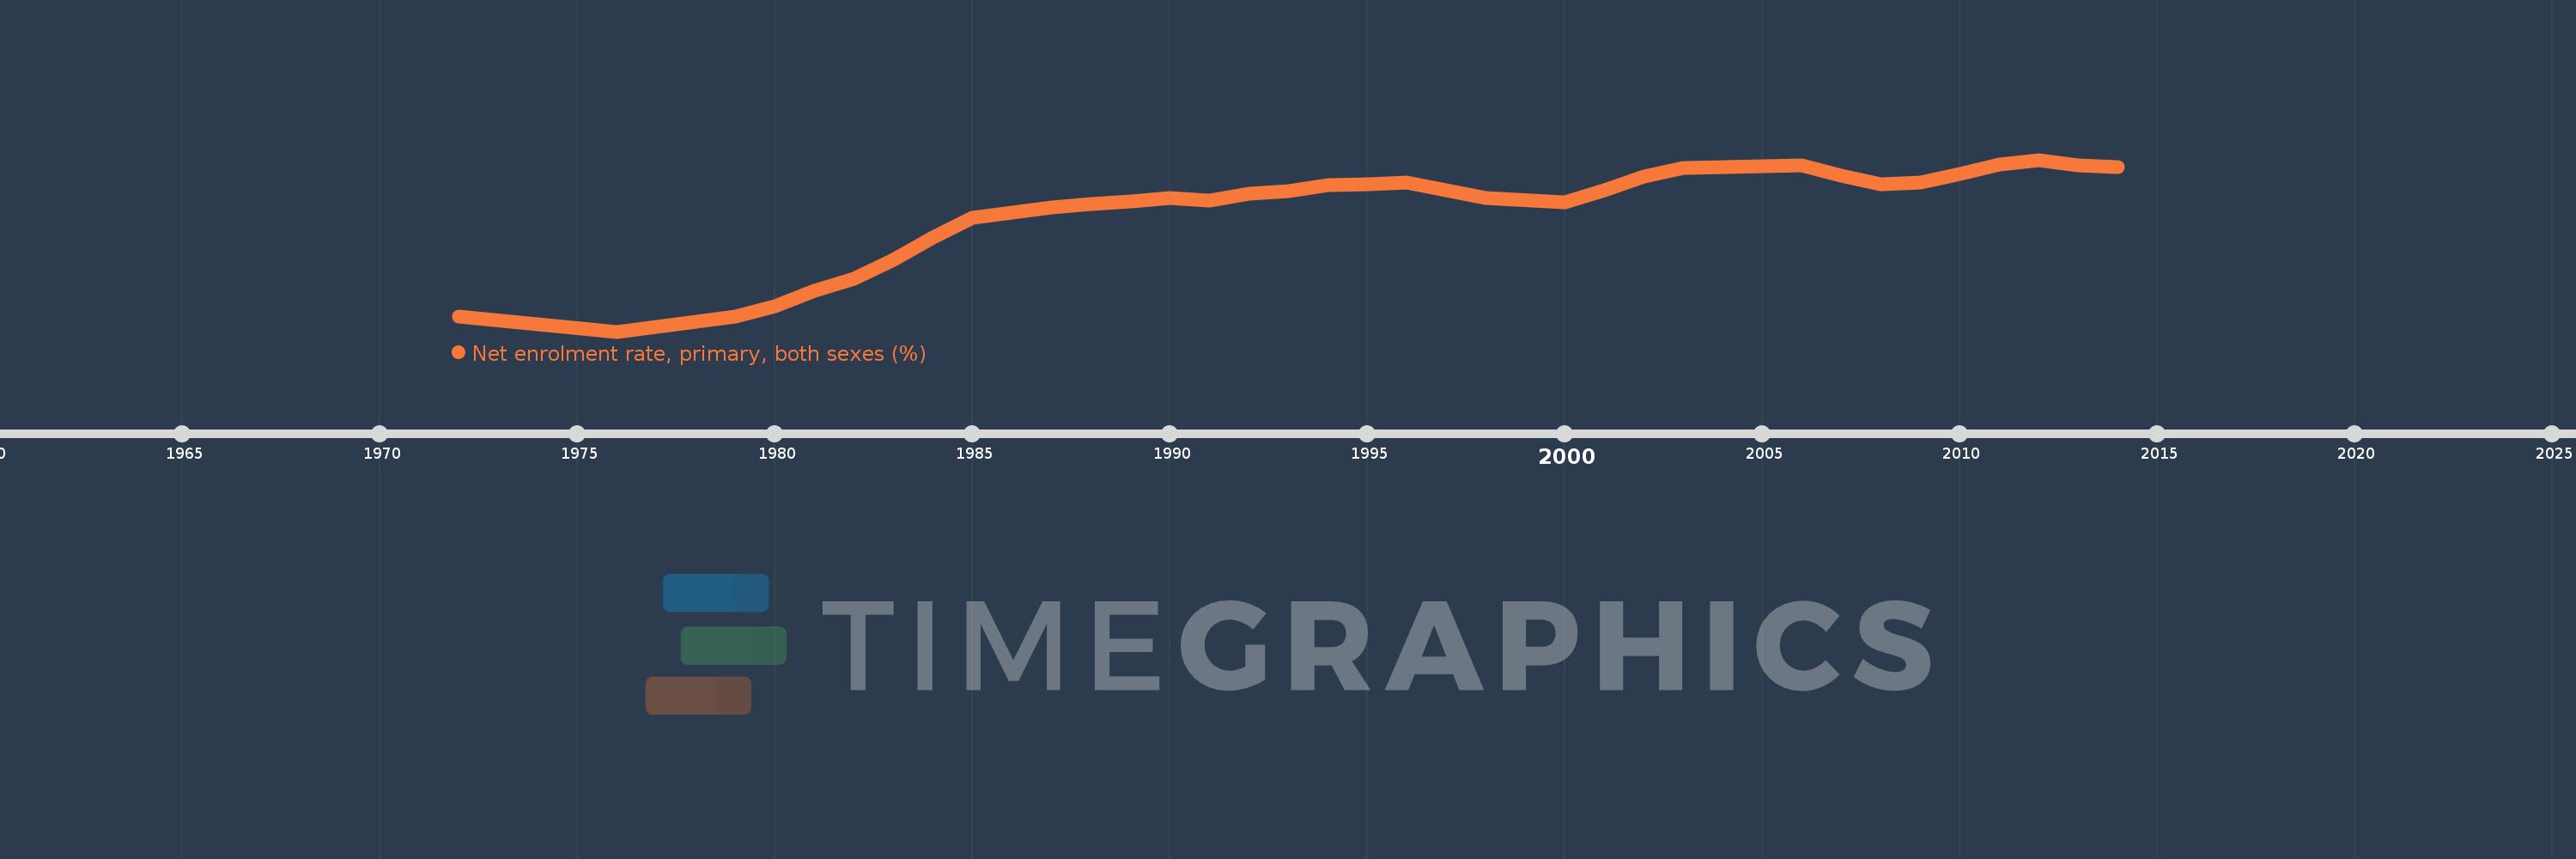
Net enrolment rate, primary, both sexes (%)
2014,2013,2012,2011,2010,2009,2008,2007,2006,2005,2004,2003,2002,2001,2000,1998,1997,1996,1995,1994,1993,1992,1991,1990,1989,1988,1987,1986,1985,1984,1983,1982,1981,1980,1979,1976,1972
Estas estatísticas em outros países:
AfghanistanAlbaniaAlgeriaAngolaAntigua and BarbudaArab WorldArgentinaArmeniaArubaAustraliaAustriaAzerbaijanBahamas, TheBahrainBangladeshBarbadosBelarusBelgiumBelizeBeninBermudaBhutanBoliviaBosnia and HerzegovinaBotswanaBrazilBrunei DarussalamBulgariaBurkina FasoBurundiCabo VerdeCambodiaCameroonCanadaCaribbean small statesCentral African RepublicCentral Europe and the BalticsChadChileChinaColombiaComorosCongo, Dem. Rep.Congo, Rep.Costa RicaCote d'IvoireCroatiaCubaCyprusDenmarkDjiboutiDominicaDominican RepublicEarly-demographic dividendEast Asia & PacificEast Asia & Pacific (excluding high income)East Asia & Pacific (IDA & IBRD countries)EcuadorEgypt, Arab Rep.El SalvadorEquatorial GuineaEritreaEstoniaEthiopiaEuro areaEurope & Central AsiaEurope & Central Asia (excluding high income)Europe & Central Asia (IDA & IBRD countries)European UnionFijiFinlandFragile and conflict affected situationsFranceGabonGambia, TheGeorgiaGermanyGhanaGreeceGrenadaGuatemalaGuineaGuinea-BissauGuyanaHaitiHeavily indebted poor countries (HIPC)High incomeHondurasHong Kong SAR, ChinaHungaryIBRD onlyIcelandIDA & IBRD totalIDA blendIDA onlyIDA totalIndiaIndonesiaIran, Islamic Rep.IraqIrelandIsraelItalyJamaicaJapanJordanKazakhstanKenyaKiribatiKorea, Dem. People’s Rep.Korea, Rep.KuwaitKyrgyz RepublicLao PDRLate-demographic dividendLatin America & Caribbean Latin America & Caribbean (excluding high income)Latin America & the Caribbean (IDA & IBRD countries)LatviaLeast developed countries: UN classificationLebanonLesothoLiberiaLibyaLiechtensteinLithuaniaLow & middle incomeLow incomeLower middle incomeLuxembourgMacao SAR, ChinaMacedonia, FYRMadagascarMalawiMalaysiaMaldivesMaliMaltaMarshall IslandsMauritaniaMauritiusMexicoMicronesia, Fed. Sts.Middle East & North AfricaMiddle East & North Africa (excluding high income)Middle East & North Africa (IDA & IBRD countries)Middle incomeMoldovaMongoliaMontenegroMoroccoMozambiqueMyanmarNamibiaNauruNepalNetherlandsNew ZealandNicaraguaNigerNigeriaNorth AmericaNorwayOECD membersOmanOther small statesPacific island small statesPakistanPalauPanamaPapua New GuineaParaguayPeruPhilippinesPolandPortugalPost-demographic dividendPre-demographic dividendPuerto RicoQatarRomaniaRussian FederationRwandaSamoaSan MarinoSao Tome and PrincipeSaudi ArabiaSenegalSerbiaSeychellesSierra LeoneSloveniaSmall statesSolomon IslandsSomaliaSouth AfricaSouth AsiaSouth Asia (IDA & IBRD)South SudanSpainSri LankaSt. Kitts and NevisSt. LuciaSt. Vincent and the GrenadinesSub-Saharan Africa Sub-Saharan Africa (excluding high income)Sub-Saharan Africa (IDA & IBRD countries)SudanSurinameSwazilandSwedenSwitzerlandSyrian Arab RepublicTajikistanTanzaniaThailandTimor-LesteTogoTongaTrinidad and TobagoTunisiaTurkeyTuvaluUgandaUkraineUnited Arab EmiratesUnited KingdomUnited StatesUpper middle incomeUruguayUzbekistanVanuatuVenezuela, RBVietnamWest Bank and GazaWorldYemen, Rep.ZambiaZimbabwe Linha do tempo:
Nesta escala de tempo está apresentado um gráfico de 1972 ano até 2014 ano Tunisia. Dados de 1971 ano ausente. O número de observações reais por data: 37.
Fonte (nome):
Indicadores de desenvolvimento mundial
Fonte (organização):
UNESCO Institute for Statistics
Categorias:
Education
Foi atualizado:
23 abr 2017 ano
Indicadores de alterações dos valores ao longo dos anos
Mínimo:
75.798
1 jan 1976 ano
Máximo:
99.634
1 jan 2012 ano
Na data de observação
Valor
Mudança absoluta
A alteração em relação ao valor anterior
1 jan 1972 ano
77.875
+77.875
0.0%
1 jan 1976 ano
75.798
-2.077
-2.67%
1 jan 1979 ano
77.927
+2.129
2.81%
1 jan 1980 ano
79.371
+1.444
1.85%
1 jan 1981 ano
81.441
+2.07
2.61%
1 jan 1982 ano
83.174
+1.733
2.13%
1 jan 1983 ano
85.768
+2.594
3.12%
1 jan 1984 ano
88.827
+3.06
3.57%
1 jan 1985 ano
91.573
+2.746
3.09%
1 jan 1986 ano
92.32
+0.747
0.82%
1 jan 1987 ano
92.997
+0.677
0.73%
1 jan 1988 ano
93.517
+0.519
0.56%
1 jan 1989 ano
93.836
+0.319
0.34%
1 jan 1990 ano
94.297
+0.462
0.49%
1 jan 1991 ano
93.946
-0.352
-0.37%
1 jan 1992 ano
94.95
+1.004
1.07%
1 jan 1993 ano
95.336
+0.387
0.41%
1 jan 1994 ano
96.174
+0.838
0.88%
1 jan 1995 ano
96.189
+0.014
0.01%
1 jan 1996 ano
96.424
+0.236
0.25%
1 jan 1997 ano
95.461
-0.964
-1.0%
1 jan 1998 ano
94.338
-1.123
-1.18%
1 jan 2000 ano
93.732
-0.606
-0.64%
1 jan 2001 ano
95.438
+1.707
1.82%
1 jan 2002 ano
97.286
+1.848
1.94%
1 jan 2003 ano
98.533
+1.247
1.28%
1 jan 2004 ano
98.586
+0.052
0.05%
1 jan 2005 ano
98.7
+0.114
0.12%
1 jan 2006 ano
98.87
+0.17
0.17%
1 jan 2007 ano
97.406
-1.463
-1.48%
1 jan 2008 ano
96.233
-1.173
-1.2%
1 jan 2009 ano
96.427
+0.194
0.2%
1 jan 2010 ano
97.622
+1.195
1.24%
1 jan 2011 ano
98.945
+1.323
1.36%
1 jan 2012 ano
99.634
+0.689
0.7%
1 jan 2013 ano
98.813
-0.821
-0.82%
1 jan 2014 ano
98.565
-0.248
-0.25%
Classificação de países por estatísticas atuais por anos


Comentários: