30
/pt/
AIzaSyAYiBZKx7MnpbEhh9jyipgxe19OcubqV5w
April 1, 2024
30809
Europe & Central Asia
ECS
false
2
1
Internet users (per 100 people)
2016,2015,2014,2013,2012,2011,2010,2009,2008,2007,2006,2005,2004,2003,2002,2001,2000,1999,1998,1997,1996,1995,1994,1993,1991
Download
Biblioteca de estatísticas globais →Europe & Central Asia →

Internet users (per 100 people)

Estas estatísticas em outros países:

AfghanistanAlbaniaAlgeriaAmerican SamoaAndorraAngolaAntigua and BarbudaArab WorldArgentinaArmeniaArubaAustraliaAustriaAzerbaijanBahamas, TheBahrainBangladeshBarbadosBelarusBelgiumBelizeBeninBermudaBhutanBoliviaBosnia and HerzegovinaBotswanaBrazilBritish Virgin IslandsBrunei DarussalamBulgariaBurkina FasoBurundiCabo VerdeCambodiaCameroonCanadaCaribbean small statesCayman IslandsCentral African RepublicCentral Europe and the BalticsChadChileChinaColombiaComorosCongo, Dem. Rep.Congo, Rep.Costa RicaCote d'IvoireCroatiaCubaCyprusCzech RepublicDenmarkDjiboutiDominicaDominican RepublicEarly-demographic dividendEast Asia & PacificEast Asia & Pacific (excluding high income)East Asia & Pacific (IDA & IBRD countries)EcuadorEgypt, Arab Rep.El SalvadorEquatorial GuineaEritreaEstoniaEthiopiaEuro areaEurope & Central AsiaEurope & Central Asia (excluding high income)Europe & Central Asia (IDA & IBRD countries)European UnionFaroe IslandsFijiFinlandFragile and conflict affected situationsFranceFrench PolynesiaGabonGambia, TheGeorgiaGermanyGhanaGibraltarGreeceGreenlandGrenadaGuamGuatemalaGuineaGuinea-BissauGuyanaHaitiHeavily indebted poor countries (HIPC)High incomeHondurasHong Kong SAR, ChinaHungaryIBRD onlyIcelandIDA & IBRD totalIDA blendIDA onlyIDA totalIndiaIndonesiaIran, Islamic Rep.IraqIrelandIsraelItalyJamaicaJapanJordanKazakhstanKenyaKiribatiKorea, Dem. People’s Rep.Korea, Rep.KuwaitKyrgyz RepublicLao PDRLate-demographic dividendLatin America & Caribbean Latin America & Caribbean (excluding high income)Latin America & the Caribbean (IDA & IBRD countries)LatviaLeast developed countries: UN classificationLebanonLesothoLiberiaLibyaLiechtensteinLithuaniaLow & middle incomeLow incomeLower middle incomeLuxembourgMacao SAR, ChinaMacedonia, FYRMadagascarMalawiMalaysiaMaldivesMaliMaltaMarshall IslandsMauritaniaMauritiusMexicoMicronesia, Fed. Sts.Middle East & North AfricaMiddle East & North Africa (excluding high income)Middle East & North Africa (IDA & IBRD countries)Middle incomeMoldovaMonacoMongoliaMontenegroMoroccoMozambiqueMyanmarNamibiaNauruNepalNetherlandsNew CaledoniaNew ZealandNicaraguaNigerNigeriaNorth AmericaNorthern Mariana IslandsNorwayOECD membersOmanOther small statesPacific island small statesPakistanPalauPanamaPapua New GuineaParaguayPeruPhilippinesPolandPortugalPost-demographic dividendPre-demographic dividendPuerto RicoQatarRomaniaRussian FederationRwandaSamoaSan MarinoSao Tome and PrincipeSaudi ArabiaSenegalSerbiaSeychellesSierra LeoneSingaporeSlovak RepublicSloveniaSmall statesSolomon IslandsSomaliaSouth AfricaSouth AsiaSouth Asia (IDA & IBRD)South SudanSpainSri LankaSt. Kitts and NevisSt. LuciaSt. Vincent and the GrenadinesSub-Saharan Africa Sub-Saharan Africa (excluding high income)Sub-Saharan Africa (IDA & IBRD countries)SudanSurinameSwazilandSwedenSwitzerlandSyrian Arab RepublicTajikistanTanzaniaThailandTimor-LesteTogoTongaTrinidad and TobagoTunisiaTurkeyTurkmenistanTurks and Caicos IslandsTuvaluUgandaUkraineUnited Arab EmiratesUnited KingdomUnited StatesUpper middle incomeUruguayUzbekistanVanuatuVenezuela, RBVietnamVirgin Islands (U.S.)West Bank and GazaWorldYemen, Rep.ZambiaZimbabwe

Linha do tempo:

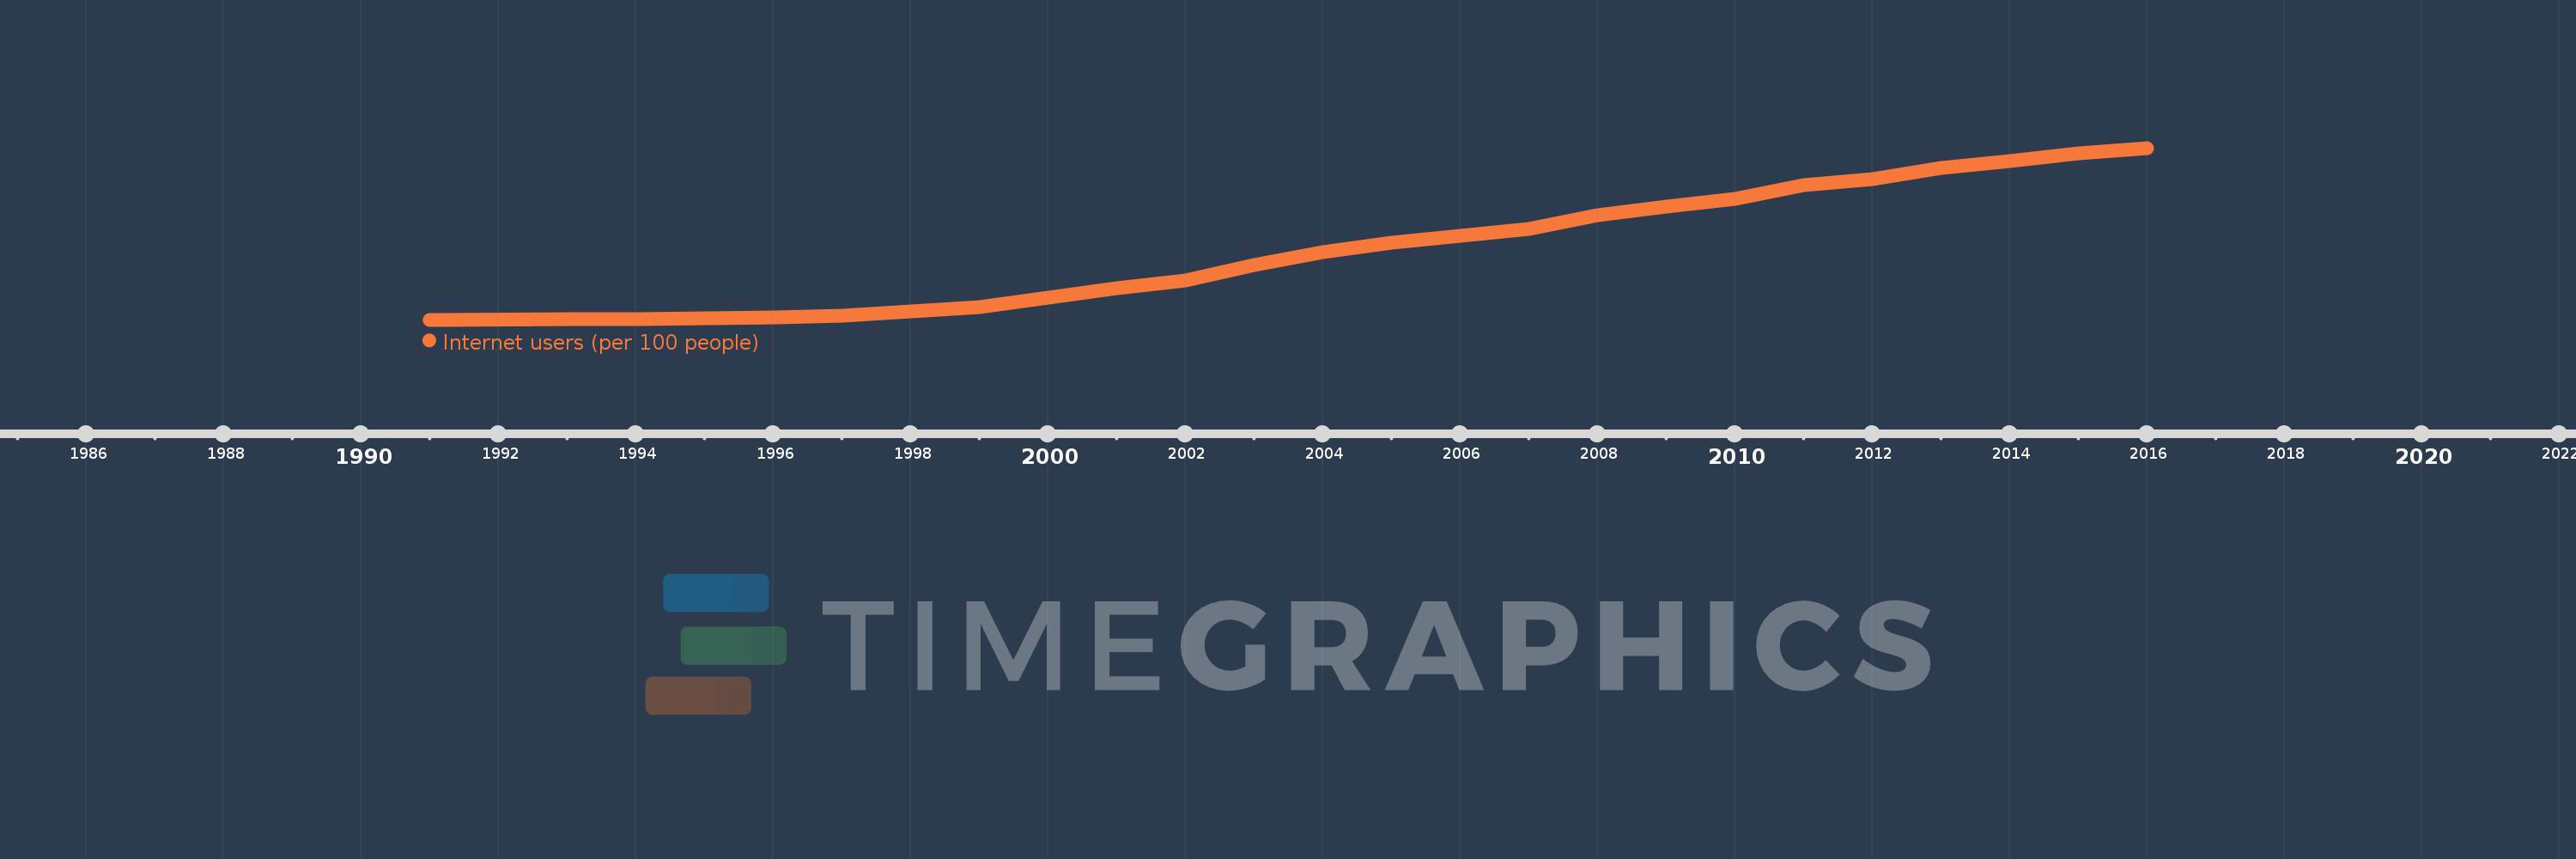
Nesta escala de tempo está apresentado um gráfico de 1991 ano até 2016 ano Europe & Central Asia. Dados de 1990 ano ausente. O número de observações reais por data: 25.

Fonte (nome):

Indicadores de desenvolvimento mundial

Fonte (organização):

International Telecommunication Union, World Telecommunication/ICT Development Report and database, and World Bank estimates.

Categorias:

Infrastructure

Foi atualizado:

23 abr 2017 ano

Indicadores de alterações dos valores ao longo dos anos

Em média:
29.456
Mínimo:
0.048
1 jan 1991 ano
Máximo:
71.744
1 jan 2016 ano
Na data de observação
Valor
Mudança absoluta
A alteração em relação ao valor anterior
1 jan 1991 ano
0.048
+0.048
0.0%
1 jan 1993 ano
0.263
+0.214
445.72%
1 jan 1994 ano
0.318
+0.055
21.02%
1 jan 1995 ano
0.565
+0.247
77.76%
1 jan 1996 ano
1.024
+0.459
81.29%
1 jan 1997 ano
1.843
+0.819
79.97%
1 jan 1998 ano
3.361
+1.518
82.38%
1 jan 1999 ano
5.437
+2.076
61.78%
1 jan 2000 ano
9.245
+3.808
70.04%
1 jan 2001 ano
13.185
+3.94
42.62%
1 jan 2002 ano
16.406
+3.222
24.43%
1 jan 2003 ano
23.059
+6.653
40.55%
1 jan 2004 ano
28.364
+5.305
23.01%
1 jan 2005 ano
32.36
+3.996
14.09%
1 jan 2006 ano
35.226
+2.867
8.86%
1 jan 2007 ano
38.083
+2.857
8.11%
1 jan 2008 ano
43.673
+5.591
14.68%
1 jan 2009 ano
47.357
+3.684
8.44%
1 jan 2010 ano
50.566
+3.208
6.77%
1 jan 2011 ano
56.118
+5.552
10.98%
1 jan 2012 ano
58.861
+2.742
4.89%
1 jan 2013 ano
63.485
+4.625
7.86%
1 jan 2014 ano
66.306
+2.82
4.44%
1 jan 2015 ano
69.509
+3.204
4.83%
1 jan 2016 ano
71.744
+2.235
3.21%

Classificação de países por estatísticas atuais por anos