30
/pt/
AIzaSyAYiBZKx7MnpbEhh9jyipgxe19OcubqV5w
April 1, 2024
252049
St. Vincent and the Grenadines
VCT
true
2
1
Internet users (per 100 people)
2016,2015,2014,2013,2012,2011,2010,2009,2008,2007,2006,2005,2004,2003,2002,2001,2000,1999,1998,1997,1996,1991
Download
Biblioteca de estatísticas globais →St. Vincent and the Grenadines →

Internet users (per 100 people)

Estas estatísticas em outros países:

AfghanistanAlbaniaAlgeriaAmerican SamoaAndorraAngolaAntigua and BarbudaArab WorldArgentinaArmeniaArubaAustraliaAustriaAzerbaijanBahamas, TheBahrainBangladeshBarbadosBelarusBelgiumBelizeBeninBermudaBhutanBoliviaBosnia and HerzegovinaBotswanaBrazilBritish Virgin IslandsBrunei DarussalamBulgariaBurkina FasoBurundiCabo VerdeCambodiaCameroonCanadaCaribbean small statesCayman IslandsCentral African RepublicCentral Europe and the BalticsChadChileChinaColombiaComorosCongo, Dem. Rep.Congo, Rep.Costa RicaCote d'IvoireCroatiaCubaCyprusCzech RepublicDenmarkDjiboutiDominicaDominican RepublicEarly-demographic dividendEast Asia & PacificEast Asia & Pacific (excluding high income)East Asia & Pacific (IDA & IBRD countries)EcuadorEgypt, Arab Rep.El SalvadorEquatorial GuineaEritreaEstoniaEthiopiaEuro areaEurope & Central AsiaEurope & Central Asia (excluding high income)Europe & Central Asia (IDA & IBRD countries)European UnionFaroe IslandsFijiFinlandFragile and conflict affected situationsFranceFrench PolynesiaGabonGambia, TheGeorgiaGermanyGhanaGibraltarGreeceGreenlandGrenadaGuamGuatemalaGuineaGuinea-BissauGuyanaHaitiHeavily indebted poor countries (HIPC)High incomeHondurasHong Kong SAR, ChinaHungaryIBRD onlyIcelandIDA & IBRD totalIDA blendIDA onlyIDA totalIndiaIndonesiaIran, Islamic Rep.IraqIrelandIsraelItalyJamaicaJapanJordanKazakhstanKenyaKiribatiKorea, Dem. People’s Rep.Korea, Rep.KuwaitKyrgyz RepublicLao PDRLate-demographic dividendLatin America & Caribbean Latin America & Caribbean (excluding high income)Latin America & the Caribbean (IDA & IBRD countries)LatviaLeast developed countries: UN classificationLebanonLesothoLiberiaLibyaLiechtensteinLithuaniaLow & middle incomeLow incomeLower middle incomeLuxembourgMacao SAR, ChinaMacedonia, FYRMadagascarMalawiMalaysiaMaldivesMaliMaltaMarshall IslandsMauritaniaMauritiusMexicoMicronesia, Fed. Sts.Middle East & North AfricaMiddle East & North Africa (excluding high income)Middle East & North Africa (IDA & IBRD countries)Middle incomeMoldovaMonacoMongoliaMontenegroMoroccoMozambiqueMyanmarNamibiaNauruNepalNetherlandsNew CaledoniaNew ZealandNicaraguaNigerNigeriaNorth AmericaNorthern Mariana IslandsNorwayOECD membersOmanOther small statesPacific island small statesPakistanPalauPanamaPapua New GuineaParaguayPeruPhilippinesPolandPortugalPost-demographic dividendPre-demographic dividendPuerto RicoQatarRomaniaRussian FederationRwandaSamoaSan MarinoSao Tome and PrincipeSaudi ArabiaSenegalSerbiaSeychellesSierra LeoneSingaporeSlovak RepublicSloveniaSmall statesSolomon IslandsSomaliaSouth AfricaSouth AsiaSouth Asia (IDA & IBRD)South SudanSpainSri LankaSt. Kitts and NevisSt. LuciaSt. Vincent and the GrenadinesSub-Saharan Africa Sub-Saharan Africa (excluding high income)Sub-Saharan Africa (IDA & IBRD countries)SudanSurinameSwazilandSwedenSwitzerlandSyrian Arab RepublicTajikistanTanzaniaThailandTimor-LesteTogoTongaTrinidad and TobagoTunisiaTurkeyTurkmenistanTurks and Caicos IslandsTuvaluUgandaUkraineUnited Arab EmiratesUnited KingdomUnited StatesUpper middle incomeUruguayUzbekistanVanuatuVenezuela, RBVietnamVirgin Islands (U.S.)West Bank and GazaWorldYemen, Rep.ZambiaZimbabwe

Linha do tempo:

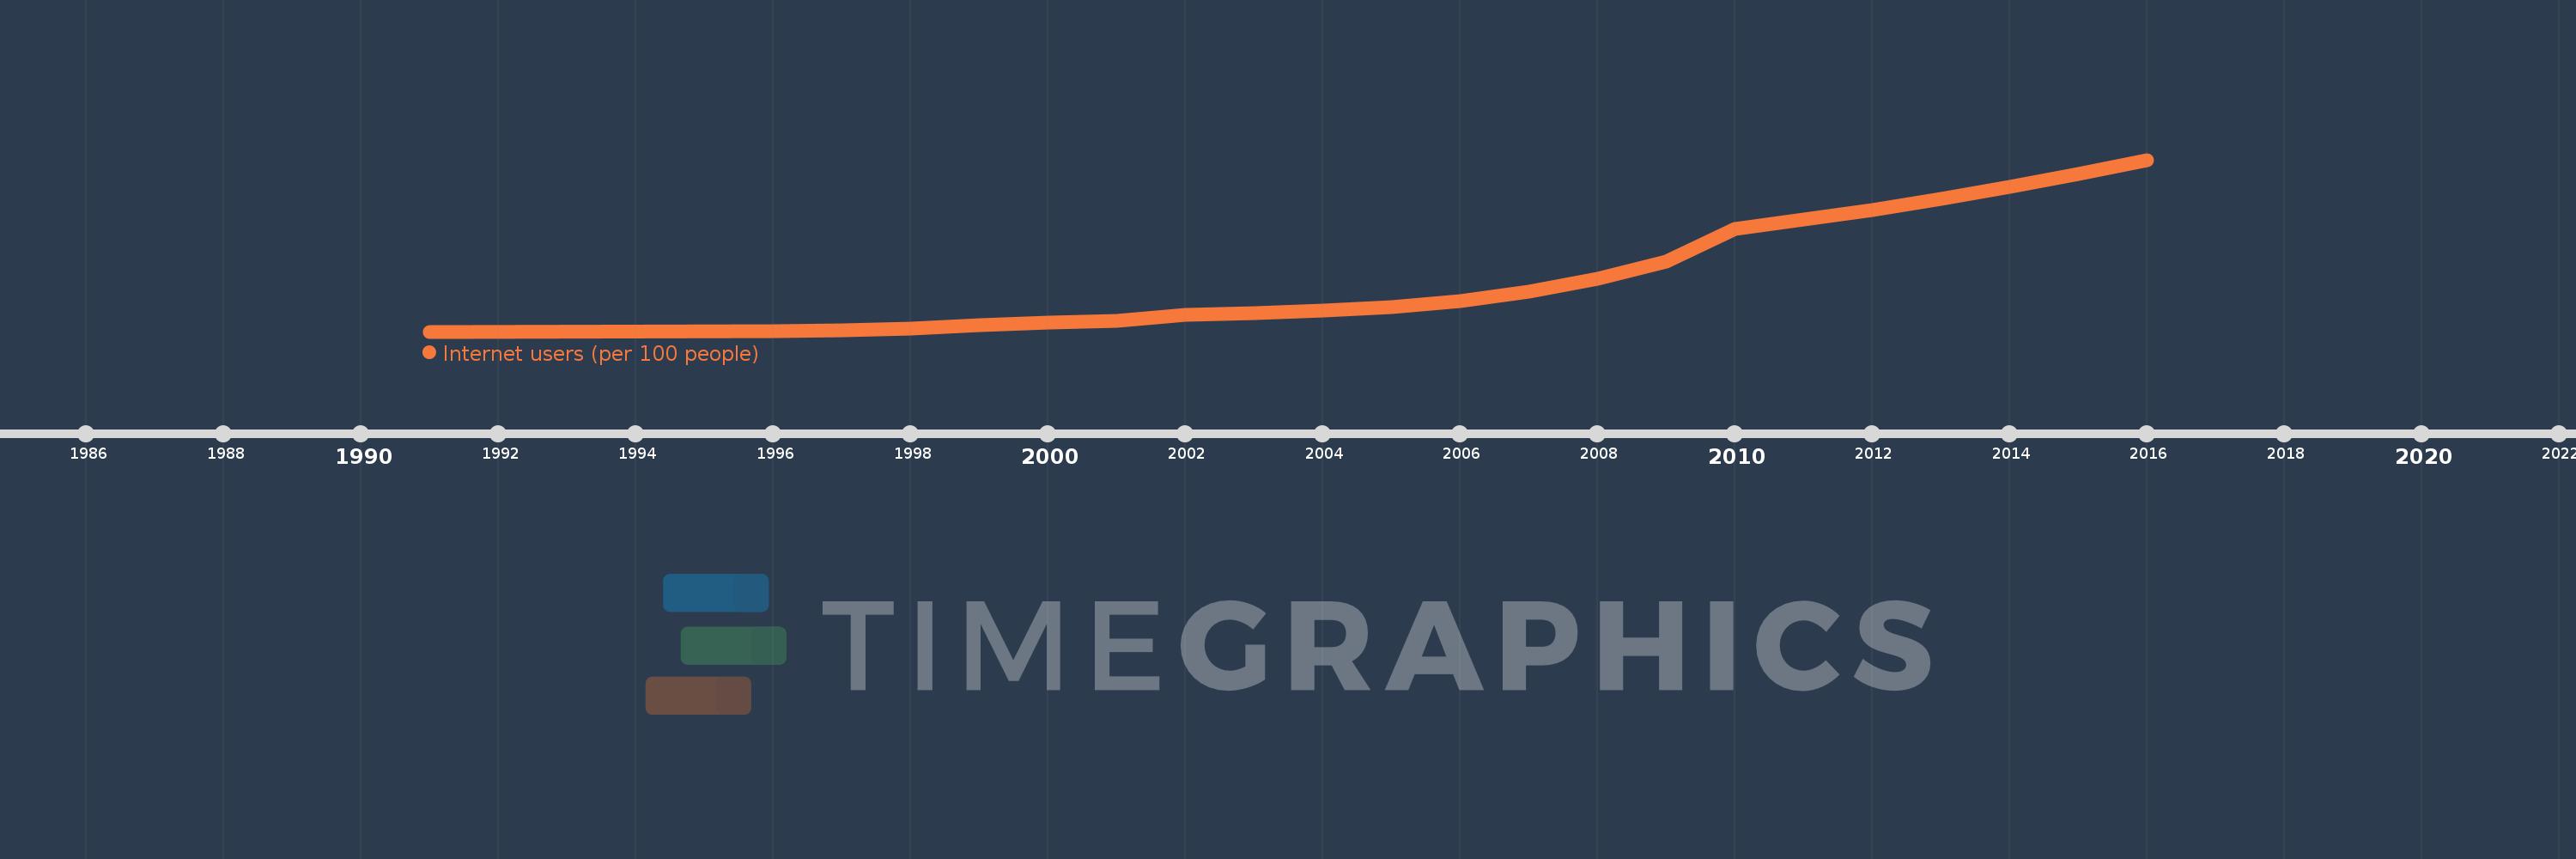
Nesta escala de tempo está apresentado um gráfico de 1991 ano até 2016 ano St. Vincent and the Grenadines. Dados de 1990 ano ausente. O número de observações reais por data: 22.

Fonte (nome):

Indicadores de desenvolvimento mundial

Fonte (organização):

International Telecommunication Union, World Telecommunication/ICT Development Report and database, and World Bank estimates.

Categorias:

Infrastructure

Foi atualizado:

23 abr 2017 ano

Indicadores de alterações dos valores ao longo dos anos

Em média:
17.098
Mínimo:
0.0
1 jan 1991 ano
Máximo:
51.77
1 jan 2016 ano
Na data de observação
Valor
Mudança absoluta
A alteração em relação ao valor anterior
1 jan 1991 ano
0.0
0.0
0.0%
1 jan 1996 ano
0.129
+0.129
%
1 jan 1997 ano
0.483
+0.355
275.68%
1 jan 1998 ano
0.926
+0.443
91.7%
1 jan 1999 ano
1.854
+0.928
100.14%
1 jan 2000 ano
2.782
+0.928
50.05%
1 jan 2001 ano
3.245
+0.463
16.64%
1 jan 2002 ano
5.095
+1.85
57.0%
1 jan 2003 ano
5.55
+0.455
8.93%
1 jan 2004 ano
6.462
+0.913
16.45%
1 jan 2005 ano
7.371
+0.909
14.06%
1 jan 2006 ano
9.198
+1.827
24.79%
1 jan 2007 ano
12.0
+2.802
30.46%
1 jan 2008 ano
16.0
+4.0
33.33%
1 jan 2009 ano
21.0
+5.0
31.25%
1 jan 2010 ano
31.0
+10.0
47.62%
1 jan 2011 ano
33.7
+2.7
8.71%
1 jan 2012 ano
36.7
+3.0
8.9%
1 jan 2013 ano
40.0
+3.3
8.99%
1 jan 2014 ano
43.5
+3.5
8.75%
1 jan 2015 ano
47.4
+3.9
8.97%
1 jan 2016 ano
51.77
+4.37
9.22%

Classificação de países por estatísticas atuais por anos