29
/pt/
pt
AIzaSyAYiBZKx7MnpbEhh9jyipgxe19OcubqV5w
April 1, 2024
30615
Europe & Central Asia
ECS
false
2
1
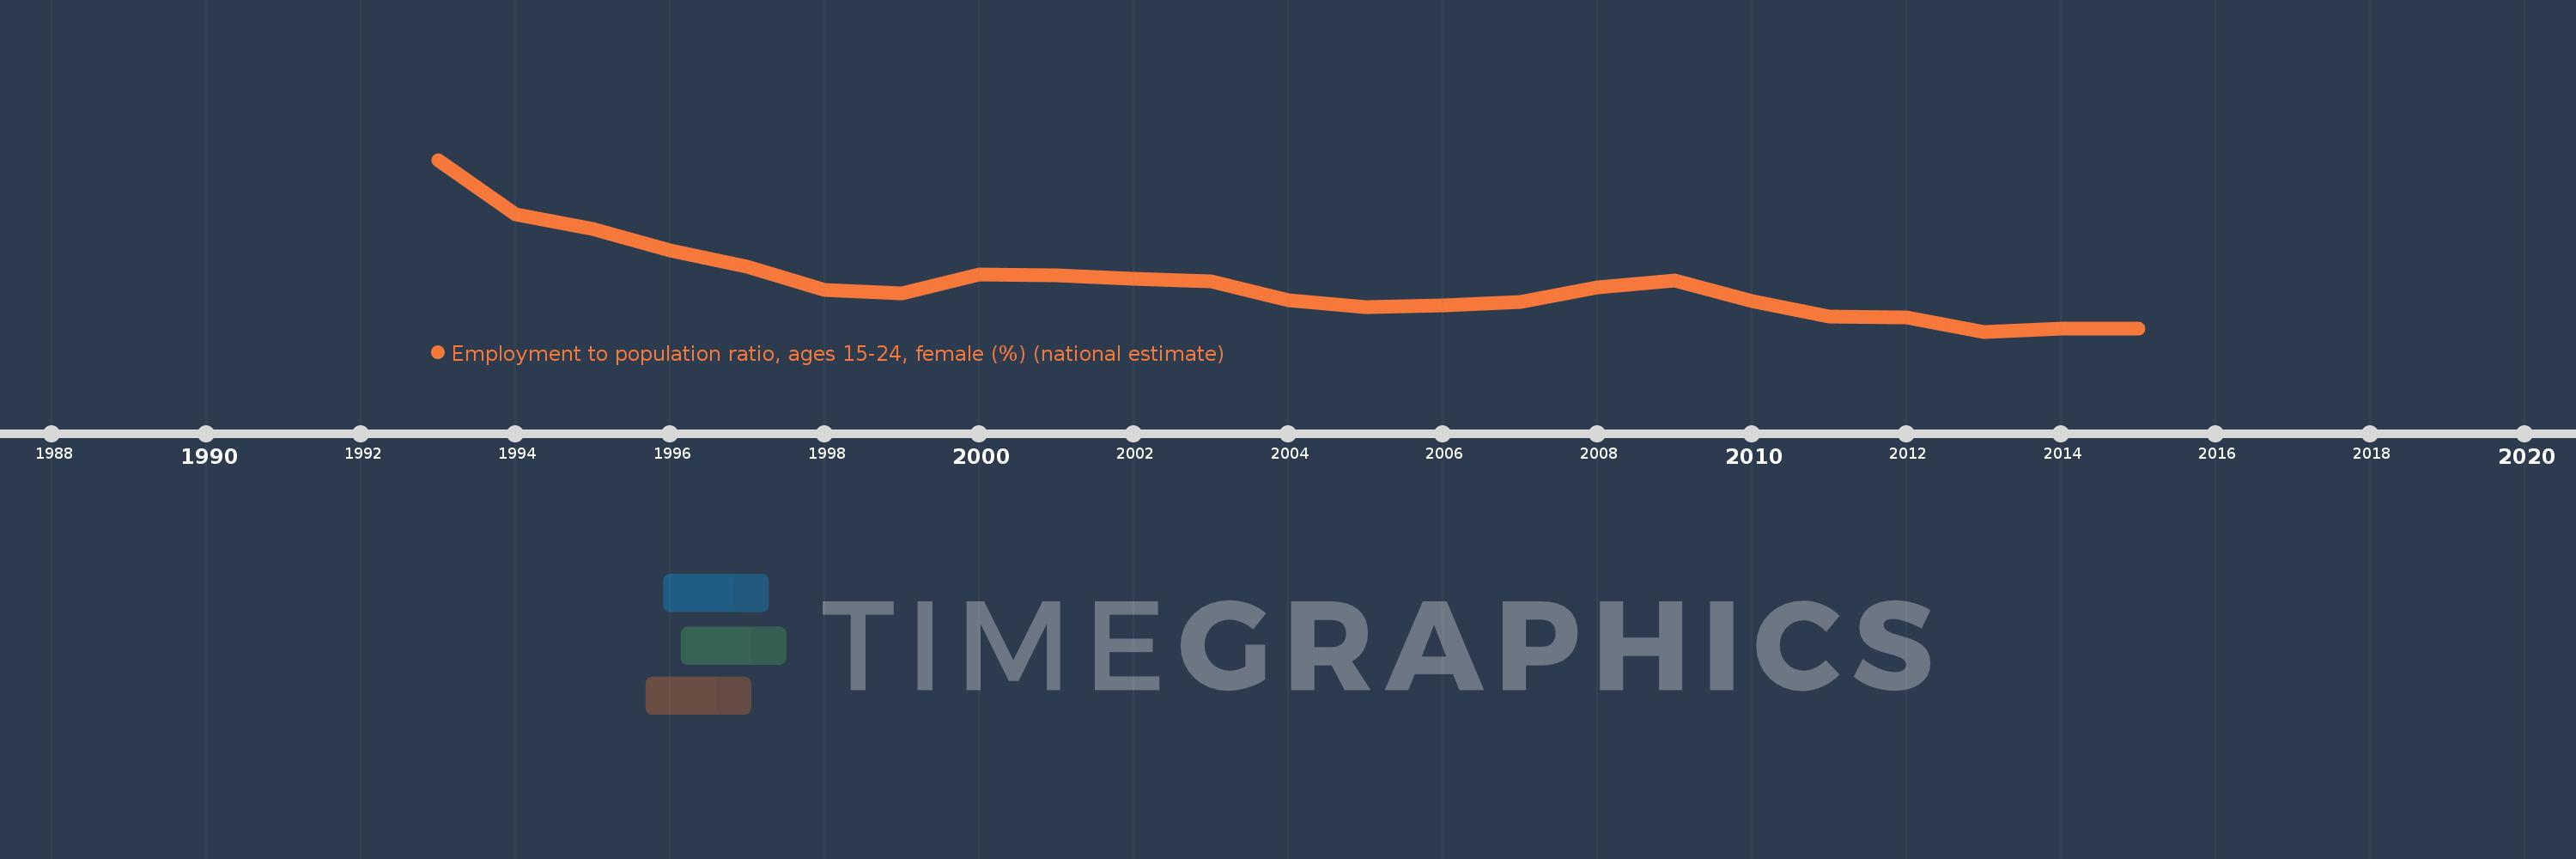
Employment to population ratio, ages 15-24, female (%) (national estimate)
2015,2014,2013,2012,2011,2010,2009,2008,2007,2006,2005,2004,2003,2002,2001,2000,1999,1998,1997,1996,1995,1994,1993
Estas estatísticas em outros países:
Linha do tempo:
Nesta escala de tempo está apresentado um gráfico de 1993 ano até 2015 ano Europe & Central Asia. Dados de 1992 ano ausente. O número de observações reais por data: 23.
Fonte (nome):
Indicadores de desenvolvimento mundial
Fonte (organização):
International Labour Organization, Key Indicators of the Labour Market database.
Categorias:
Social Protection & Labor
Foi atualizado:
23 abr 2017 ano
Indicadores de alterações dos valores ao longo dos anos
Mínimo:
29.188
1 jan 2013 ano
Máximo:
38.899
1 jan 1993 ano
Na data de observação
Valor
Mudança absoluta
A alteração em relação ao valor anterior
1 jan 1993 ano
38.899
+38.899
0.0%
1 jan 1994 ano
35.794
-3.105
-7.98%
1 jan 1995 ano
34.968
-0.826
-2.31%
1 jan 1996 ano
33.764
-1.204
-3.44%
1 jan 1997 ano
32.876
-0.888
-2.63%
1 jan 1998 ano
31.528
-1.348
-4.1%
1 jan 1999 ano
31.371
-0.157
-0.5%
1 jan 2000 ano
32.433
+1.062
3.39%
1 jan 2001 ano
32.362
-0.071
-0.22%
1 jan 2002 ano
32.172
-0.19
-0.59%
1 jan 2003 ano
32.01
-0.162
-0.5%
1 jan 2004 ano
30.983
-1.027
-3.21%
1 jan 2005 ano
30.558
-0.425
-1.37%
1 jan 2006 ano
30.666
+0.108
0.35%
1 jan 2007 ano
30.858
+0.192
0.63%
1 jan 2008 ano
31.699
+0.841
2.72%
1 jan 2009 ano
32.056
+0.357
1.13%
1 jan 2010 ano
30.905
-1.151
-3.59%
1 jan 2011 ano
30.032
-0.872
-2.82%
1 jan 2012 ano
30.012
-0.021
-0.07%
1 jan 2013 ano
29.188
-0.823
-2.74%
1 jan 2014 ano
29.334
+0.146
0.5%
1 jan 2015 ano
29.354
+0.019
0.07%
Classificação de países por estatísticas atuais por anos


Comentários: