29
/pt/
pt
AIzaSyAYiBZKx7MnpbEhh9jyipgxe19OcubqV5w
April 1, 2024
276566
United States
USA
true
2
1
Employment to population ratio, ages 15-24, female (%) (national estimate)
2015,2014,2013,2012,2011,2010,2009,2008,2007,2006,2005,2004,2003,2002,2001,2000,1999,1998,1997,1996,1995,1994,1993,1992,1991,1990,1989,1988,1987,1986,1985,1984,1983,1982,1981
Estas estatísticas em outros países:
Linha do tempo:
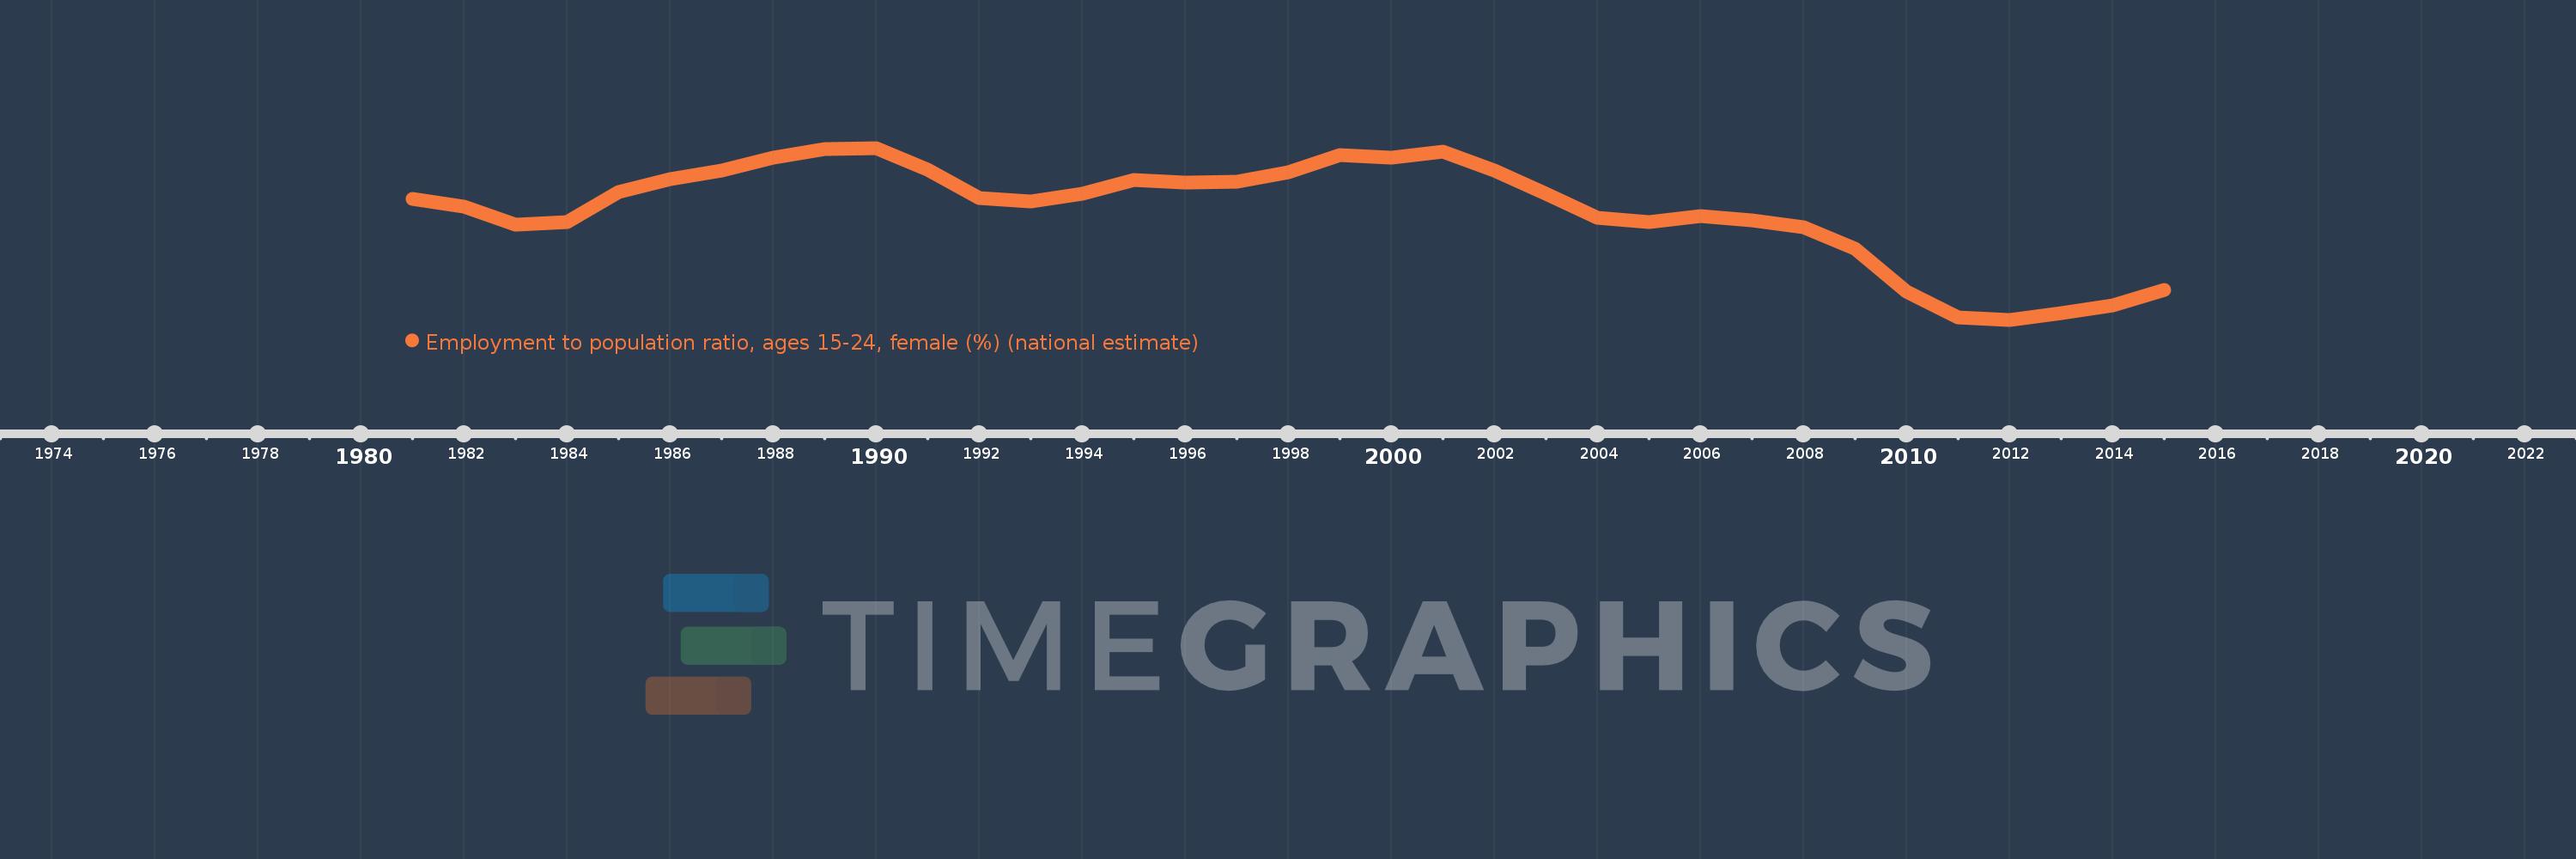
Nesta escala de tempo está apresentado um gráfico de 1981 ano até 2015 ano United States. Dados de 1980 ano ausente. O número de observações reais por data: 35.
Fonte (nome):
Indicadores de desenvolvimento mundial
Fonte (organização):
International Labour Organization, Key Indicators of the Labour Market database.
Categorias:
Social Protection & Labor
Foi atualizado:
23 abr 2017 ano
Indicadores de alterações dos valores ao longo dos anos
Mínimo:
44.9
1 jan 2012 ano
Máximo:
57.7
1 jan 1990 ano
Na data de observação
Valor
Mudança absoluta
A alteração em relação ao valor anterior
1 jan 1981 ano
53.9
+53.9
0.0%
1 jan 1982 ano
53.3
-0.6
-1.11%
1 jan 1983 ano
52.0
-1.3
-2.44%
1 jan 1984 ano
52.2
+0.2
0.38%
1 jan 1985 ano
54.4
+2.2
4.21%
1 jan 1986 ano
55.4
+1.0
1.84%
1 jan 1987 ano
56.0
+0.6
1.08%
1 jan 1988 ano
57.0
+1.0
1.79%
1 jan 1989 ano
57.6
+0.6
1.05%
1 jan 1990 ano
57.7
+0.1
0.17%
1 jan 1991 ano
56.1
-1.6
-2.77%
1 jan 1992 ano
54.0
-2.1
-3.74%
1 jan 1993 ano
53.7
-0.3
-0.56%
1 jan 1994 ano
54.3
+0.6
1.12%
1 jan 1995 ano
55.3
+1.0
1.84%
1 jan 1996 ano
55.1
-0.2
-0.36%
1 jan 1997 ano
55.2
+0.1
0.18%
1 jan 1998 ano
55.9
+0.7
1.27%
1 jan 1999 ano
57.2
+1.3
2.33%
1 jan 2000 ano
57.0
-0.2
-0.35%
1 jan 2001 ano
57.4
+0.4
0.7%
1 jan 2002 ano
56.0
-1.4
-2.44%
1 jan 2003 ano
54.3
-1.7
-3.04%
1 jan 2004 ano
52.5
-1.8
-3.31%
1 jan 2005 ano
52.2
-0.3
-0.57%
1 jan 2006 ano
52.6
+0.4
0.77%
1 jan 2007 ano
52.3
-0.3
-0.57%
1 jan 2008 ano
51.8
-0.5
-0.96%
1 jan 2009 ano
50.2
-1.6
-3.09%
1 jan 2010 ano
47.0
-3.2
-6.37%
1 jan 2011 ano
45.1
-1.9
-4.04%
1 jan 2012 ano
44.9
-0.2
-0.44%
1 jan 2013 ano
45.4
+0.5
1.11%
1 jan 2014 ano
46.0
+0.6
1.32%
1 jan 2015 ano
47.1
+1.1
2.39%
Classificação de países por estatísticas atuais por anos


Comentários: