29
/pt/
pt
AIzaSyAYiBZKx7MnpbEhh9jyipgxe19OcubqV5w
April 1, 2024
29007
East Asia & Pacific (IDA & IBRD countries)
TEA
false
2
1
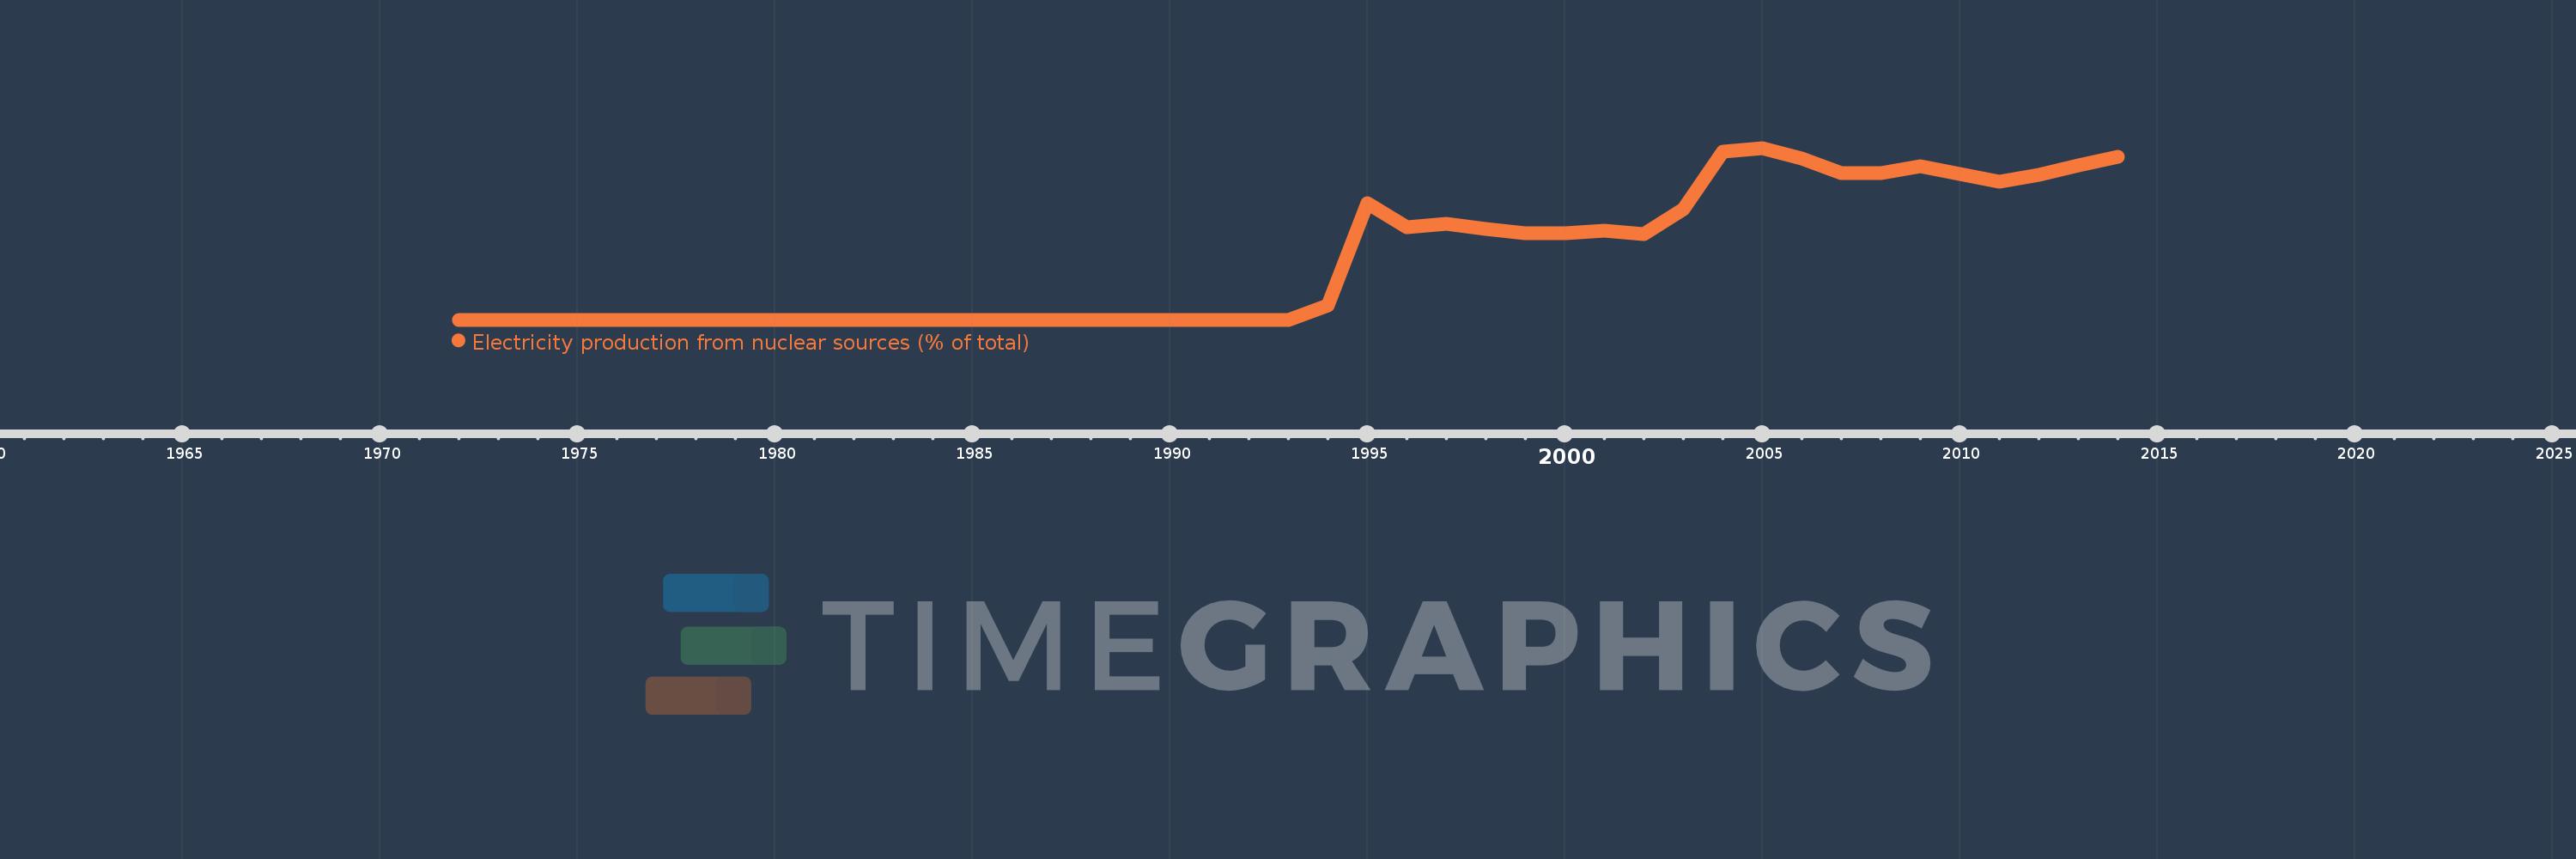
Electricity production from nuclear sources (% of total)
2014,2013,2012,2011,2010,2009,2008,2007,2006,2005,2004,2003,2002,2001,2000,1999,1998,1997,1996,1995,1994,1993,1992,1991,1990,1989,1988,1987,1986,1985,1984,1983,1982,1981,1980,1979,1978,1977,1976,1975,1974,1973,1972
Estas estatísticas em outros países:
AlbaniaAlgeriaAngolaArab WorldArgentinaArmeniaAustraliaAustriaAzerbaijanBahrainBangladeshBelarusBelgiumBeninBoliviaBosnia and HerzegovinaBotswanaBrazilBrunei DarussalamBulgariaCambodiaCameroonCanadaCentral Europe and the BalticsChileChinaColombiaCongo, Dem. Rep.Congo, Rep.Costa RicaCote d'IvoireCroatiaCubaCuracaoCyprusCzech RepublicDenmarkDominican RepublicEarly-demographic dividendEast Asia & PacificEast Asia & Pacific (excluding high income)East Asia & Pacific (IDA & IBRD countries)EcuadorEgypt, Arab Rep.El SalvadorEritreaEstoniaEthiopiaEuro areaEurope & Central AsiaEurope & Central Asia (excluding high income)Europe & Central Asia (IDA & IBRD countries)European UnionFinlandFragile and conflict affected situationsFranceGabonGeorgiaGermanyGhanaGibraltarGreeceGuatemalaHaitiHeavily indebted poor countries (HIPC)High incomeHondurasHong Kong SAR, ChinaHungaryIBRD onlyIcelandIDA & IBRD totalIDA blendIDA onlyIDA totalIndiaIndonesiaIran, Islamic Rep.IraqIrelandIsraelItalyJamaicaJapanJordanKazakhstanKenyaKorea, Dem. People’s Rep.Korea, Rep.KosovoKuwaitKyrgyz RepublicLate-demographic dividendLatin America & Caribbean Latin America & Caribbean (excluding high income)Latin America & the Caribbean (IDA & IBRD countries)LatviaLeast developed countries: UN classificationLebanonLibyaLithuaniaLow & middle incomeLower middle incomeLuxembourgMacedonia, FYRMalaysiaMaltaMauritiusMexicoMiddle East & North AfricaMiddle East & North Africa (excluding high income)Middle East & North Africa (IDA & IBRD countries)Middle incomeMoldovaMongoliaMontenegroMoroccoMozambiqueMyanmarNamibiaNepalNetherlandsNew ZealandNicaraguaNigerNigeriaNorth AmericaNorwayOECD membersOmanOther small statesPakistanPanamaParaguayPeruPhilippinesPolandPortugalPost-demographic dividendPre-demographic dividendQatarRomaniaRussian FederationSaudi ArabiaSenegalSerbiaSingaporeSlovak RepublicSloveniaSmall statesSouth AfricaSouth AsiaSouth Asia (IDA & IBRD)South SudanSpainSri LankaSub-Saharan Africa Sub-Saharan Africa (excluding high income)Sub-Saharan Africa (IDA & IBRD countries)SudanSwedenSwitzerlandSyrian Arab RepublicTajikistanTanzaniaThailandTogoTrinidad and TobagoTunisiaTurkeyTurkmenistanUkraineUnited Arab EmiratesUnited KingdomUnited StatesUpper middle incomeUruguayUzbekistanVenezuela, RBVietnamWorldYemen, Rep.ZambiaZimbabwe Linha do tempo:
Nesta escala de tempo está apresentado um gráfico de 1972 ano até 2014 ano East Asia & Pacific (IDA & IBRD countries). Dados de 1971 ano ausente. O número de observações reais por data: 43.
Fonte (nome):
Indicadores de desenvolvimento mundial
Fonte (organização):
IEA Statistics © OECD/IEA 2014 (http://www.iea.org/stats/index.asp), subject to https://www.iea.org/t&c/termsandconditions/
Categorias:
Energy & Mining, Climate Change, Infrastructure
Foi atualizado:
23 abr 2017 ano
Indicadores de alterações dos valores ao longo dos anos
Máximo:
1.902
1 jan 2005 ano
Na data de observação
Valor
Mudança absoluta
A alteração em relação ao valor anterior
1 jan 1972 ano
0.0
0.0
0.0%
1 jan 1994 ano
0.156
+0.156
%
1 jan 1995 ano
1.291
+1.135
728.04%
1 jan 1996 ano
1.025
-0.266
-20.6%
1 jan 1997 ano
1.059
+0.034
3.29%
1 jan 1998 ano
1.006
-0.052
-4.95%
1 jan 1999 ano
0.958
-0.048
-4.79%
1 jan 2000 ano
0.959
+0.001
0.07%
1 jan 2001 ano
0.984
+0.025
2.63%
1 jan 2002 ano
0.945
-0.039
-3.94%
1 jan 2003 ano
1.228
+0.283
29.9%
1 jan 2004 ano
1.859
+0.631
51.43%
1 jan 2005 ano
1.902
+0.043
2.29%
1 jan 2006 ano
1.784
-0.118
-6.18%
1 jan 2007 ano
1.627
-0.157
-8.81%
1 jan 2008 ano
1.626
-0.001
-0.07%
1 jan 2009 ano
1.695
+0.069
4.22%
1 jan 2010 ano
1.618
-0.077
-4.52%
1 jan 2011 ano
1.526
-0.092
-5.71%
1 jan 2012 ano
1.605
+0.079
5.19%
1 jan 2013 ano
1.706
+0.102
6.34%
1 jan 2014 ano
1.804
+0.098
5.74%
Classificação de países por estatísticas atuais por anos


Comentários: