29
/pt/
pt
AIzaSyAYiBZKx7MnpbEhh9jyipgxe19OcubqV5w
April 1, 2024
133040
Finland
FIN
true
2
1
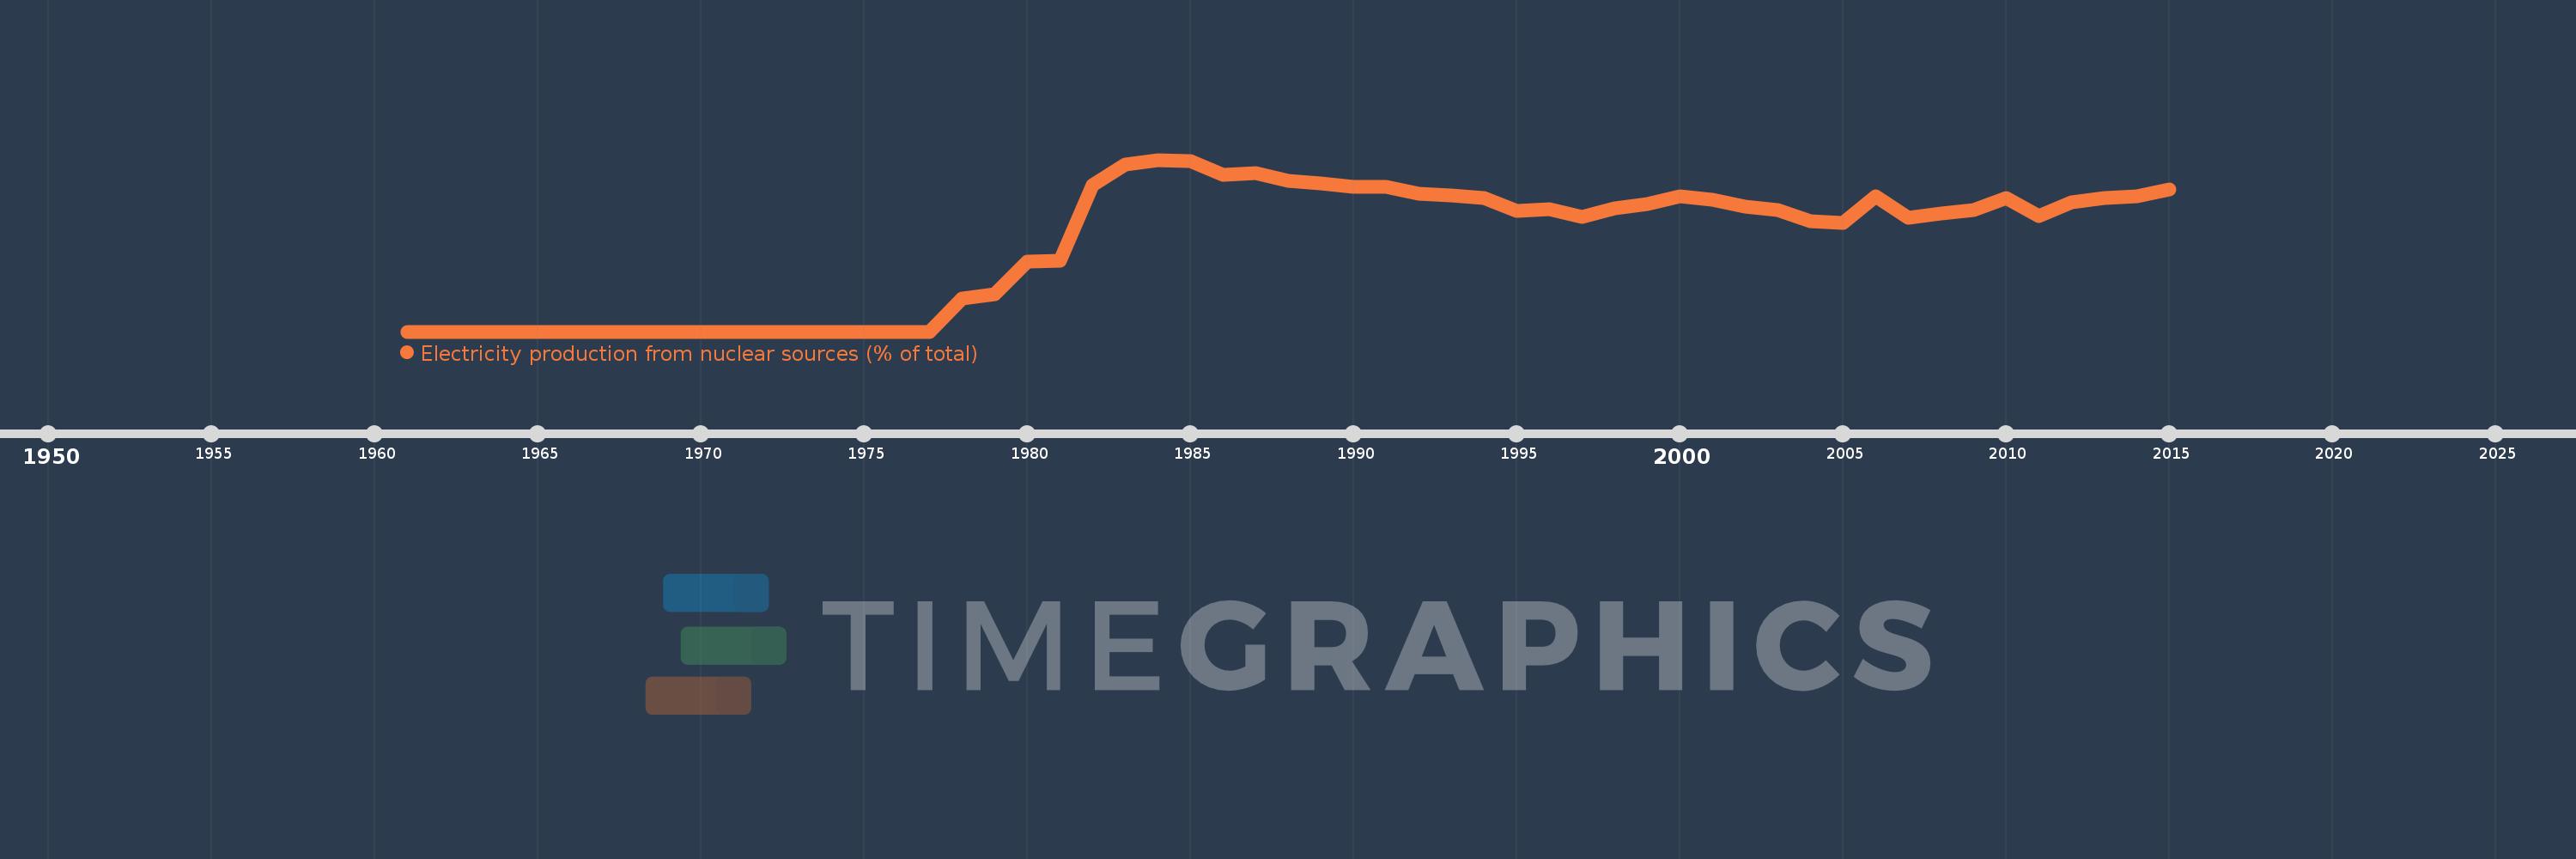
Electricity production from nuclear sources (% of total)
2015,2014,2013,2012,2011,2010,2009,2008,2007,2006,2005,2004,2003,2002,2001,2000,1999,1998,1997,1996,1995,1994,1993,1992,1991,1990,1989,1988,1987,1986,1985,1984,1983,1982,1981,1980,1979,1978,1977,1976,1975,1974,1973,1972,1971,1970,1969,1968,1967,1966,1965,1964,1963,1962,1961
Estas estatísticas em outros países:
AlbaniaAlgeriaAngolaArab WorldArgentinaArmeniaAustraliaAustriaAzerbaijanBahrainBangladeshBelarusBelgiumBeninBoliviaBosnia and HerzegovinaBotswanaBrazilBrunei DarussalamBulgariaCambodiaCameroonCanadaCentral Europe and the BalticsChileChinaColombiaCongo, Dem. Rep.Congo, Rep.Costa RicaCote d'IvoireCroatiaCubaCuracaoCyprusCzech RepublicDenmarkDominican RepublicEarly-demographic dividendEast Asia & PacificEast Asia & Pacific (excluding high income)East Asia & Pacific (IDA & IBRD countries)EcuadorEgypt, Arab Rep.El SalvadorEritreaEstoniaEthiopiaEuro areaEurope & Central AsiaEurope & Central Asia (excluding high income)Europe & Central Asia (IDA & IBRD countries)European UnionFinlandFragile and conflict affected situationsFranceGabonGeorgiaGermanyGhanaGibraltarGreeceGuatemalaHaitiHeavily indebted poor countries (HIPC)High incomeHondurasHong Kong SAR, ChinaHungaryIBRD onlyIcelandIDA & IBRD totalIDA blendIDA onlyIDA totalIndiaIndonesiaIran, Islamic Rep.IraqIrelandIsraelItalyJamaicaJapanJordanKazakhstanKenyaKorea, Dem. People’s Rep.Korea, Rep.KosovoKuwaitKyrgyz RepublicLate-demographic dividendLatin America & Caribbean Latin America & Caribbean (excluding high income)Latin America & the Caribbean (IDA & IBRD countries)LatviaLeast developed countries: UN classificationLebanonLibyaLithuaniaLow & middle incomeLower middle incomeLuxembourgMacedonia, FYRMalaysiaMaltaMauritiusMexicoMiddle East & North AfricaMiddle East & North Africa (excluding high income)Middle East & North Africa (IDA & IBRD countries)Middle incomeMoldovaMongoliaMontenegroMoroccoMozambiqueMyanmarNamibiaNepalNetherlandsNew ZealandNicaraguaNigerNigeriaNorth AmericaNorwayOECD membersOmanOther small statesPakistanPanamaParaguayPeruPhilippinesPolandPortugalPost-demographic dividendPre-demographic dividendQatarRomaniaRussian FederationSaudi ArabiaSenegalSerbiaSingaporeSlovak RepublicSloveniaSmall statesSouth AfricaSouth AsiaSouth Asia (IDA & IBRD)South SudanSpainSri LankaSub-Saharan Africa Sub-Saharan Africa (excluding high income)Sub-Saharan Africa (IDA & IBRD countries)SudanSwedenSwitzerlandSyrian Arab RepublicTajikistanTanzaniaThailandTogoTrinidad and TobagoTunisiaTurkeyTurkmenistanUkraineUnited Arab EmiratesUnited KingdomUnited StatesUpper middle incomeUruguayUzbekistanVenezuela, RBVietnamWorldYemen, Rep.ZambiaZimbabwe Linha do tempo:
Nesta escala de tempo está apresentado um gráfico de 1961 ano até 2015 ano Finland. Dados de 1960 ano ausente. O número de observações reais por data: 55.
Fonte (nome):
Indicadores de desenvolvimento mundial
Fonte (organização):
IEA Statistics © OECD/IEA 2014 (http://www.iea.org/stats/index.asp), subject to https://www.iea.org/t&c/termsandconditions/
Categorias:
Energy & Mining, Climate Change, Infrastructure
Foi atualizado:
23 abr 2017 ano
Indicadores de alterações dos valores ao longo dos anos
Máximo:
41.994
1 jan 1984 ano
Na data de observação
Valor
Mudança absoluta
A alteração em relação ao valor anterior
1 jan 1961 ano
0.0
0.0
0.0%
1 jan 1978 ano
8.037
+8.037
%
1 jan 1979 ano
9.135
+1.098
13.66%
1 jan 1980 ano
17.18
+8.045
88.08%
1 jan 1981 ano
17.233
+0.053
0.31%
1 jan 1982 ano
35.848
+18.615
108.02%
1 jan 1983 ano
40.743
+4.895
13.66%
1 jan 1984 ano
41.994
+1.25
3.07%
1 jan 1985 ano
41.661
-0.333
-0.79%
1 jan 1986 ano
38.336
-3.325
-7.98%
1 jan 1987 ano
38.686
+0.35
0.91%
1 jan 1988 ano
36.789
-1.897
-4.9%
1 jan 1989 ano
36.293
-0.496
-1.35%
1 jan 1990 ano
35.472
-0.821
-2.26%
1 jan 1991 ano
35.338
-0.134
-0.38%
1 jan 1992 ano
33.648
-1.691
-4.78%
1 jan 1993 ano
33.365
-0.283
-0.84%
1 jan 1994 ano
32.627
-0.738
-2.21%
1 jan 1995 ano
29.6
-3.026
-9.28%
1 jan 1996 ano
30.009
+0.408
1.38%
1 jan 1997 ano
28.074
-1.934
-6.45%
1 jan 1998 ano
30.204
+2.13
7.59%
1 jan 1999 ano
31.144
+0.94
3.11%
1 jan 2000 ano
33.077
+1.932
6.2%
1 jan 2001 ano
32.128
-0.949
-2.87%
1 jan 2002 ano
30.575
-1.553
-4.83%
1 jan 2003 ano
29.748
-0.826
-2.7%
1 jan 2004 ano
26.961
-2.788
-9.37%
1 jan 2005 ano
26.466
-0.495
-1.83%
1 jan 2006 ano
32.975
+6.509
24.59%
1 jan 2007 ano
27.832
-5.143
-15.6%
1 jan 2008 ano
28.829
+0.997
3.58%
1 jan 2009 ano
29.648
+0.819
2.84%
1 jan 2010 ano
32.647
+2.999
10.11%
1 jan 2011 ano
28.264
-4.383
-13.42%
1 jan 2012 ano
31.555
+3.291
11.64%
1 jan 2013 ano
32.652
+1.097
3.48%
1 jan 2014 ano
33.131
+0.478
1.46%
1 jan 2015 ano
34.669
+1.538
4.64%
Classificação de países por estatísticas atuais por anos


Comentários: