29
/pt/
pt
AIzaSyAYiBZKx7MnpbEhh9jyipgxe19OcubqV5w
April 1, 2024
28864
East Asia & Pacific (IDA & IBRD countries)
TEA
false
2
1
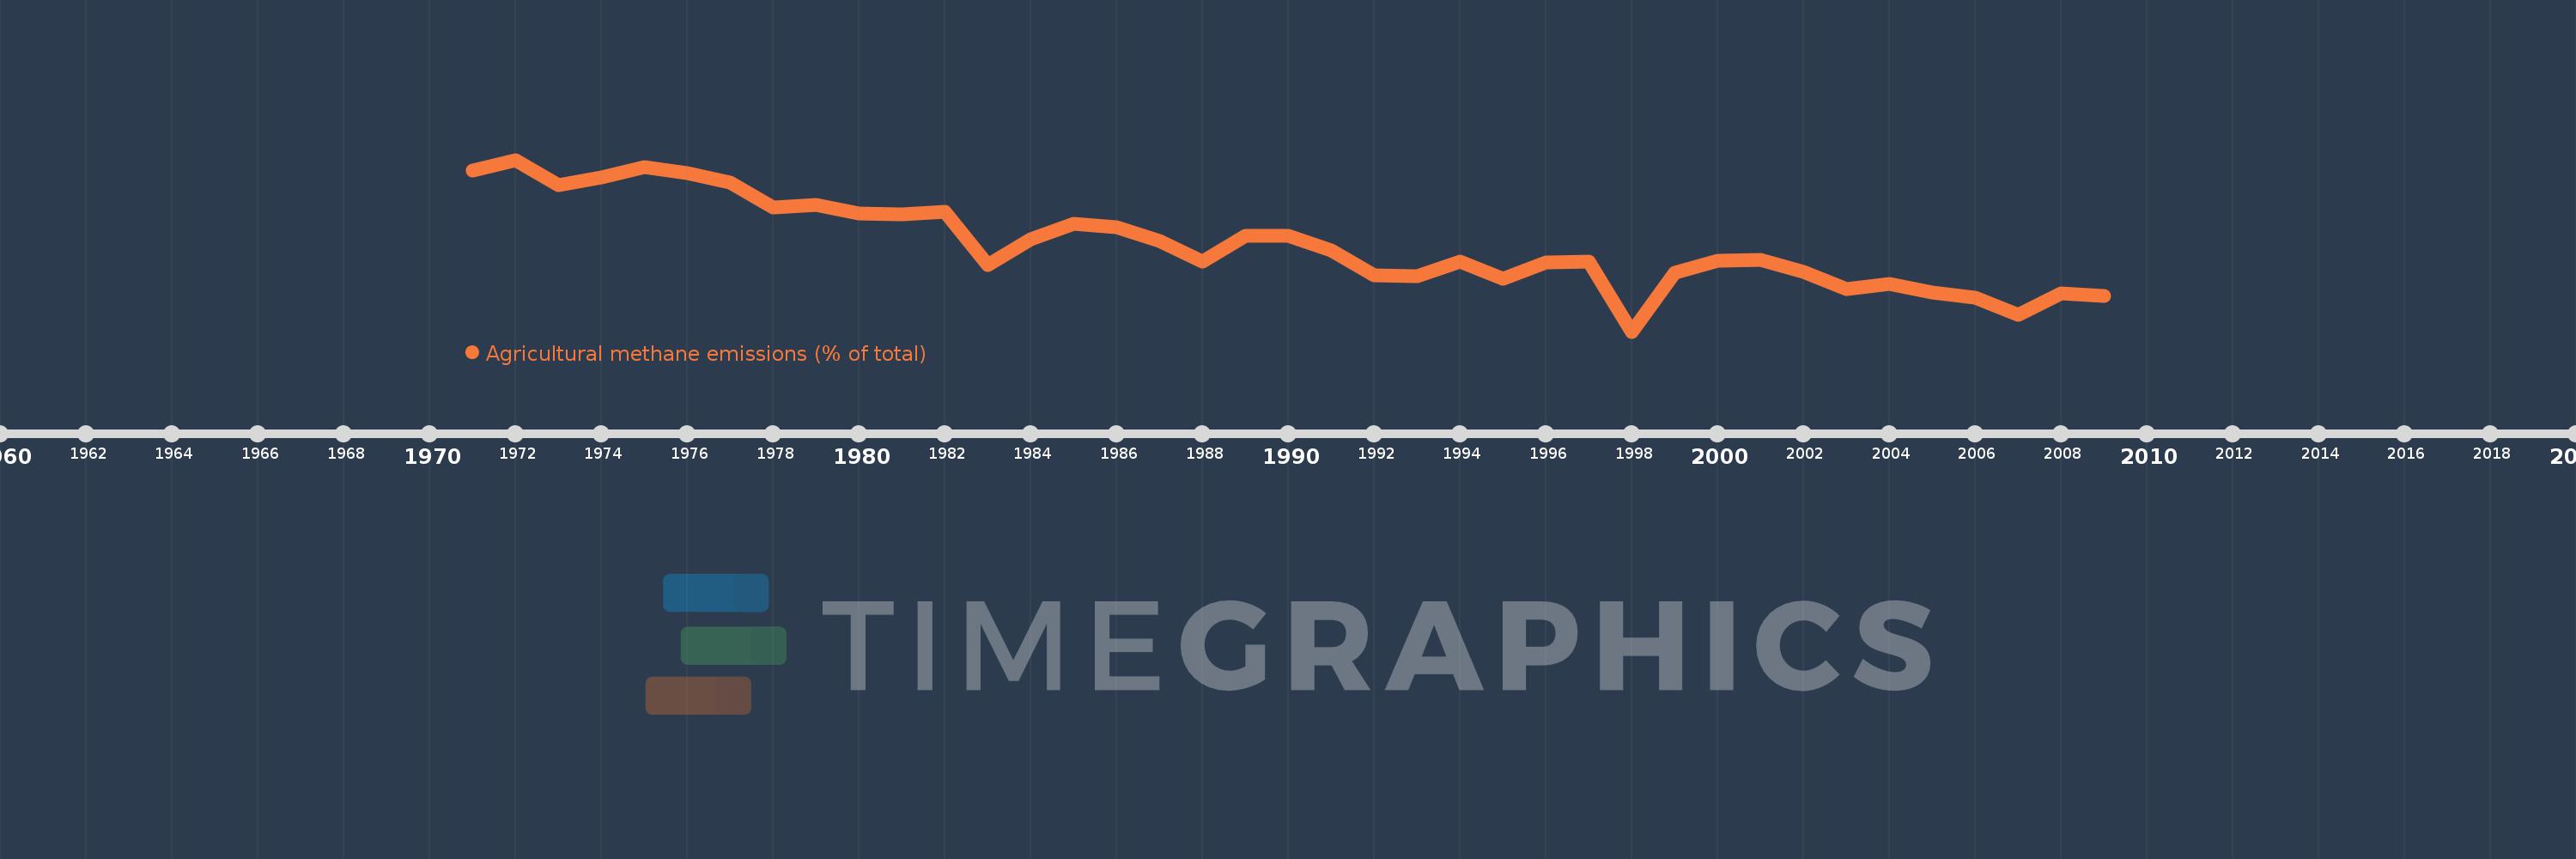
Agricultural methane emissions (% of total)
2009,2008,2007,2006,2005,2004,2003,2002,2001,2000,1999,1998,1997,1996,1995,1994,1993,1992,1991,1990,1989,1988,1987,1986,1985,1984,1983,1982,1981,1980,1979,1978,1977,1976,1975,1974,1973,1972,1971
Estas estatísticas em outros países:
AfghanistanAlbaniaAlgeriaAmerican SamoaAngolaAntigua and BarbudaArab WorldArgentinaArmeniaArubaAustraliaAustriaAzerbaijanBahamas, TheBahrainBangladeshBarbadosBelarusBelgiumBelizeBeninBermudaBhutanBoliviaBosnia and HerzegovinaBotswanaBrazilBritish Virgin IslandsBrunei DarussalamBulgariaBurkina FasoBurundiCabo VerdeCambodiaCameroonCanadaCaribbean small statesCayman IslandsCentral African RepublicCentral Europe and the BalticsChadChileChinaColombiaComorosCongo, Dem. Rep.Congo, Rep.Costa RicaCote d'IvoireCroatiaCubaCyprusCzech RepublicDenmarkDjiboutiDominicaDominican RepublicEarly-demographic dividendEast Asia & PacificEast Asia & Pacific (excluding high income)East Asia & Pacific (IDA & IBRD countries)EcuadorEgypt, Arab Rep.El SalvadorEquatorial GuineaEritreaEstoniaEthiopiaEuro areaEurope & Central AsiaEurope & Central Asia (excluding high income)Europe & Central Asia (IDA & IBRD countries)European UnionFaroe IslandsFijiFinlandFragile and conflict affected situationsFranceFrench PolynesiaGabonGambia, TheGeorgiaGermanyGhanaGibraltarGreeceGreenlandGrenadaGuamGuatemalaGuineaGuinea-BissauGuyanaHaitiHeavily indebted poor countries (HIPC)High incomeHondurasHong Kong SAR, ChinaHungaryIBRD onlyIcelandIDA & IBRD totalIDA blendIDA onlyIDA totalIndiaIndonesiaIran, Islamic Rep.IraqIrelandIsraelItalyJamaicaJapanJordanKazakhstanKenyaKiribatiKorea, Dem. People’s Rep.Korea, Rep.KuwaitKyrgyz RepublicLao PDRLate-demographic dividendLatin America & Caribbean Latin America & Caribbean (excluding high income)Latin America & the Caribbean (IDA & IBRD countries)LatviaLeast developed countries: UN classificationLebanonLesothoLiberiaLibyaLithuaniaLow & middle incomeLow incomeLower middle incomeLuxembourgMacao SAR, ChinaMacedonia, FYRMadagascarMalawiMalaysiaMaldivesMaliMaltaMarshall IslandsMauritaniaMauritiusMexicoMicronesia, Fed. Sts.Middle East & North AfricaMiddle East & North Africa (excluding high income)Middle East & North Africa (IDA & IBRD countries)Middle incomeMoldovaMongoliaMoroccoMozambiqueMyanmarNamibiaNauruNepalNetherlandsNew CaledoniaNew ZealandNicaraguaNigerNigeriaNorth AmericaNorthern Mariana IslandsNorwayOECD membersOmanOther small statesPacific island small statesPakistanPalauPanamaPapua New GuineaParaguayPeruPhilippinesPolandPortugalPost-demographic dividendPre-demographic dividendPuerto RicoQatarRomaniaRussian FederationRwandaSamoaSao Tome and PrincipeSaudi ArabiaSenegalSerbiaSeychellesSierra LeoneSingaporeSlovak RepublicSloveniaSmall statesSolomon IslandsSomaliaSouth AfricaSouth AsiaSouth Asia (IDA & IBRD)SpainSri LankaSt. Kitts and NevisSt. LuciaSt. Vincent and the GrenadinesSub-Saharan Africa Sub-Saharan Africa (excluding high income)Sub-Saharan Africa (IDA & IBRD countries)SudanSurinameSwazilandSwedenSwitzerlandSyrian Arab RepublicTajikistanTanzaniaThailandTimor-LesteTogoTongaTrinidad and TobagoTunisiaTurkeyTurkmenistanTurks and Caicos IslandsTuvaluUgandaUkraineUnited Arab EmiratesUnited KingdomUnited StatesUpper middle incomeUruguayUzbekistanVanuatuVenezuela, RBVietnamVirgin Islands (U.S.)WorldYemen, Rep.ZambiaZimbabwe Linha do tempo:
Nesta escala de tempo está apresentado um gráfico de 1971 ano até 2009 ano East Asia & Pacific (IDA & IBRD countries). Dados de 1970 ano ausente. O número de observações reais por data: 39.
Fonte (nome):
Indicadores de desenvolvimento mundial
Fonte (organização):
World Bank staff estimates from original source: European Commission, Joint Research Centre (JRC)/Netherlands Environmental Assessment Agency (PBL). Emission Database for Global Atmospheric Research (EDGAR): http://edgar.jrc.ec.europa.eu/.
Categorias:
Agriculture & Rural Development, Environment
Foi atualizado:
23 abr 2017 ano
Indicadores de alterações dos valores ao longo dos anos
Mínimo:
34.484
1 jan 1998 ano
Máximo:
72.471
1 jan 1972 ano
Na data de observação
Valor
Mudança absoluta
A alteração em relação ao valor anterior
1 jan 1971 ano
70.079
+70.079
0.0%
1 jan 1972 ano
72.471
+2.392
3.41%
1 jan 1973 ano
66.823
-5.648
-7.79%
1 jan 1974 ano
68.603
+1.78
2.66%
1 jan 1975 ano
70.949
+2.346
3.42%
1 jan 1976 ano
69.441
-1.508
-2.13%
1 jan 1977 ano
67.531
-1.91
-2.75%
1 jan 1978 ano
61.934
-5.597
-8.29%
1 jan 1979 ano
62.463
+0.529
0.85%
1 jan 1980 ano
60.563
-1.9
-3.04%
1 jan 1981 ano
60.444
-0.119
-0.2%
1 jan 1982 ano
61.024
+0.58
0.96%
1 jan 1983 ano
49.179
-11.845
-19.41%
1 jan 1984 ano
54.912
+5.733
11.66%
1 jan 1985 ano
58.347
+3.435
6.26%
1 jan 1986 ano
57.642
-0.705
-1.21%
1 jan 1987 ano
54.504
-3.138
-5.44%
1 jan 1988 ano
49.899
-4.605
-8.45%
1 jan 1989 ano
55.578
+5.679
11.38%
1 jan 1990 ano
55.608
+0.03
0.05%
1 jan 1991 ano
52.41
-3.198
-5.75%
1 jan 1992 ano
46.932
-5.478
-10.45%
1 jan 1993 ano
46.758
-0.174
-0.37%
1 jan 1994 ano
49.949
+3.19
6.82%
1 jan 1995 ano
46.151
-3.797
-7.6%
1 jan 1996 ano
49.771
+3.62
7.84%
1 jan 1997 ano
49.994
+0.222
0.45%
1 jan 1998 ano
34.484
-15.51
-31.02%
1 jan 1999 ano
47.546
+13.062
37.88%
1 jan 2000 ano
50.186
+2.64
5.55%
1 jan 2001 ano
50.264
+0.078
0.16%
1 jan 2002 ano
47.747
-2.517
-5.01%
1 jan 2003 ano
43.938
-3.809
-7.98%
1 jan 2004 ano
45.065
+1.127
2.57%
1 jan 2005 ano
43.061
-2.005
-4.45%
1 jan 2006 ano
41.983
-1.078
-2.5%
1 jan 2007 ano
38.175
-3.808
-9.07%
1 jan 2008 ano
43.006
+4.832
12.66%
1 jan 2009 ano
42.286
-0.72
-1.67%
Classificação de países por estatísticas atuais por anos


Comentários: