29
/pt/
pt
AIzaSyAYiBZKx7MnpbEhh9jyipgxe19OcubqV5w
April 1, 2024
214997
Oman
OMN
true
2
1
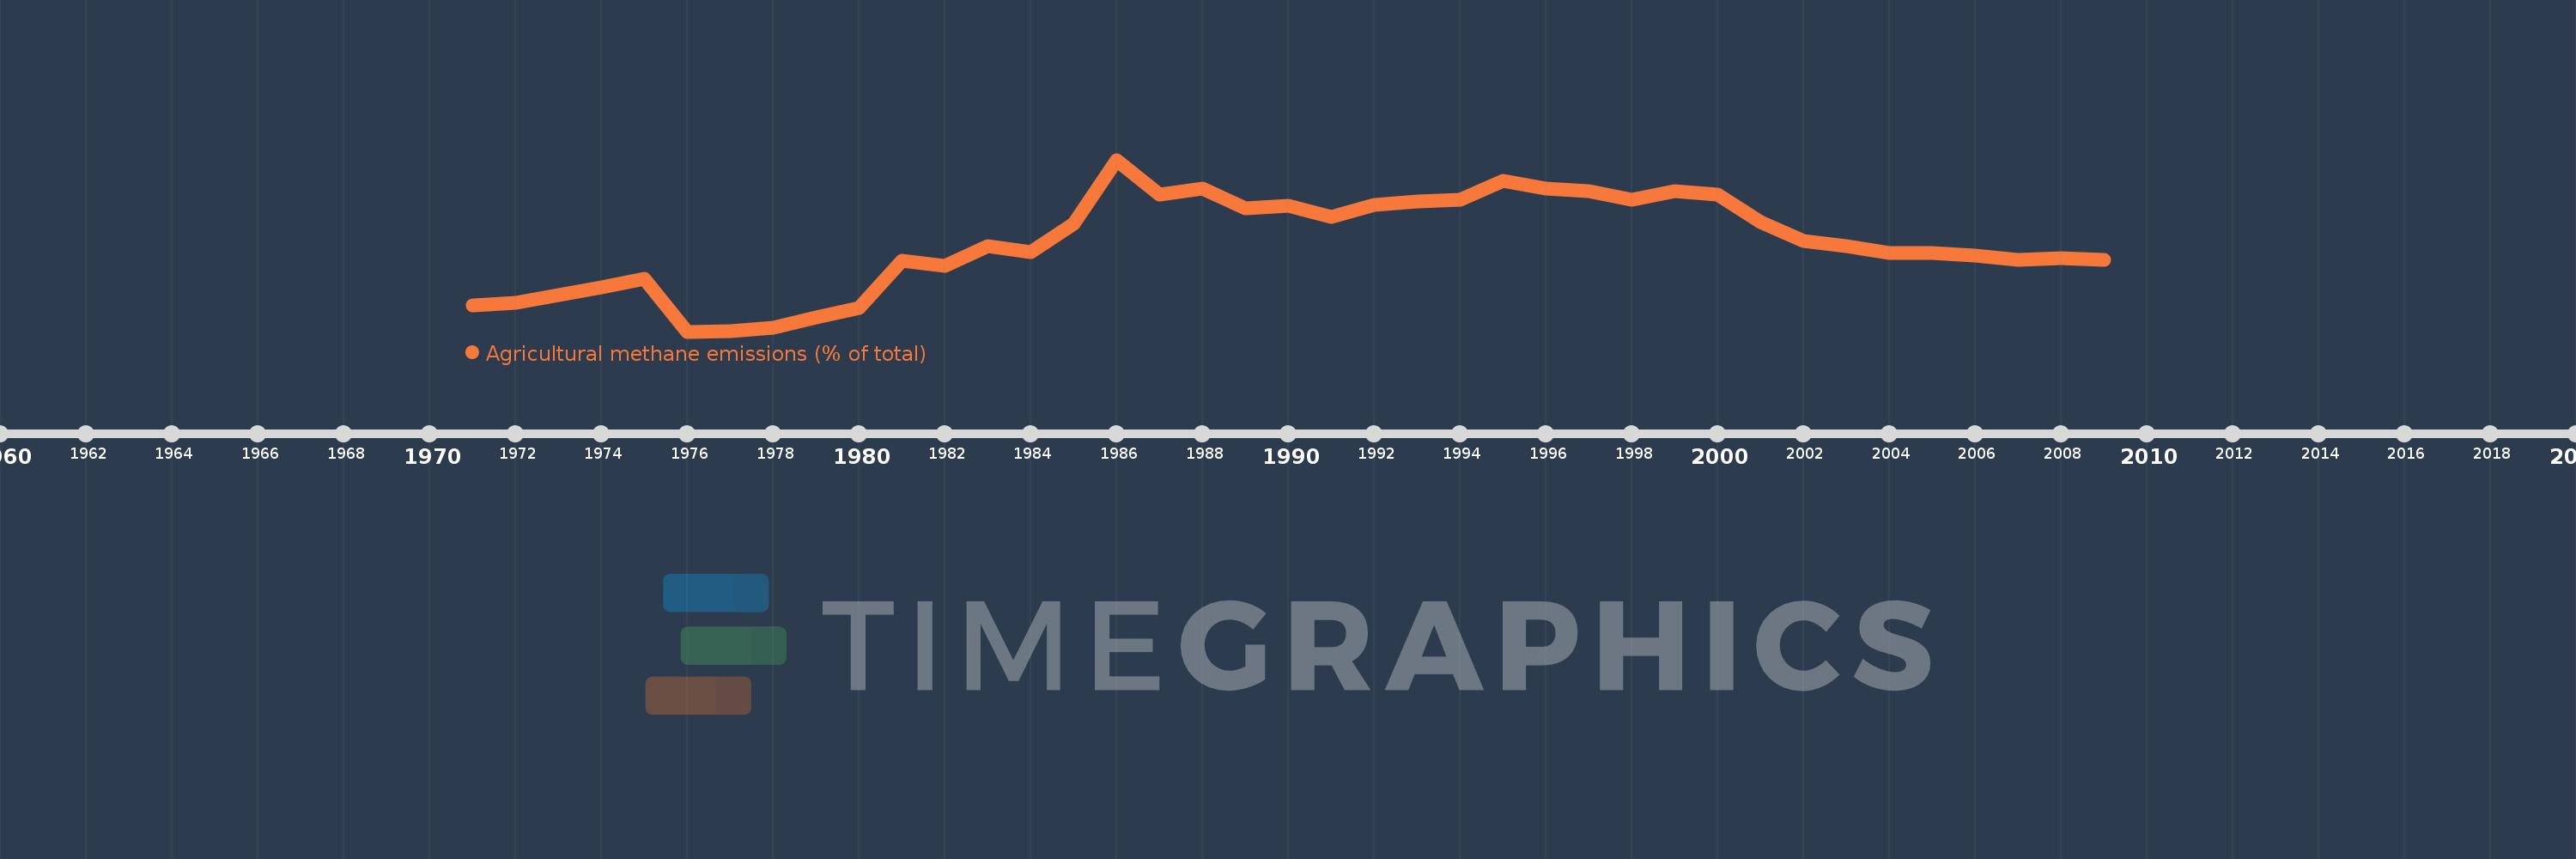
Agricultural methane emissions (% of total)
2009,2008,2007,2006,2005,2004,2003,2002,2001,2000,1999,1998,1997,1996,1995,1994,1993,1992,1991,1990,1989,1988,1987,1986,1985,1984,1983,1982,1981,1980,1979,1978,1977,1976,1975,1974,1973,1972,1971
Estas estatísticas em outros países:
AfghanistanAlbaniaAlgeriaAmerican SamoaAngolaAntigua and BarbudaArab WorldArgentinaArmeniaArubaAustraliaAustriaAzerbaijanBahamas, TheBahrainBangladeshBarbadosBelarusBelgiumBelizeBeninBermudaBhutanBoliviaBosnia and HerzegovinaBotswanaBrazilBritish Virgin IslandsBrunei DarussalamBulgariaBurkina FasoBurundiCabo VerdeCambodiaCameroonCanadaCaribbean small statesCayman IslandsCentral African RepublicCentral Europe and the BalticsChadChileChinaColombiaComorosCongo, Dem. Rep.Congo, Rep.Costa RicaCote d'IvoireCroatiaCubaCyprusCzech RepublicDenmarkDjiboutiDominicaDominican RepublicEarly-demographic dividendEast Asia & PacificEast Asia & Pacific (excluding high income)East Asia & Pacific (IDA & IBRD countries)EcuadorEgypt, Arab Rep.El SalvadorEquatorial GuineaEritreaEstoniaEthiopiaEuro areaEurope & Central AsiaEurope & Central Asia (excluding high income)Europe & Central Asia (IDA & IBRD countries)European UnionFaroe IslandsFijiFinlandFragile and conflict affected situationsFranceFrench PolynesiaGabonGambia, TheGeorgiaGermanyGhanaGibraltarGreeceGreenlandGrenadaGuamGuatemalaGuineaGuinea-BissauGuyanaHaitiHeavily indebted poor countries (HIPC)High incomeHondurasHong Kong SAR, ChinaHungaryIBRD onlyIcelandIDA & IBRD totalIDA blendIDA onlyIDA totalIndiaIndonesiaIran, Islamic Rep.IraqIrelandIsraelItalyJamaicaJapanJordanKazakhstanKenyaKiribatiKorea, Dem. People’s Rep.Korea, Rep.KuwaitKyrgyz RepublicLao PDRLate-demographic dividendLatin America & Caribbean Latin America & Caribbean (excluding high income)Latin America & the Caribbean (IDA & IBRD countries)LatviaLeast developed countries: UN classificationLebanonLesothoLiberiaLibyaLithuaniaLow & middle incomeLow incomeLower middle incomeLuxembourgMacao SAR, ChinaMacedonia, FYRMadagascarMalawiMalaysiaMaldivesMaliMaltaMarshall IslandsMauritaniaMauritiusMexicoMicronesia, Fed. Sts.Middle East & North AfricaMiddle East & North Africa (excluding high income)Middle East & North Africa (IDA & IBRD countries)Middle incomeMoldovaMongoliaMoroccoMozambiqueMyanmarNamibiaNauruNepalNetherlandsNew CaledoniaNew ZealandNicaraguaNigerNigeriaNorth AmericaNorthern Mariana IslandsNorwayOECD membersOmanOther small statesPacific island small statesPakistanPalauPanamaPapua New GuineaParaguayPeruPhilippinesPolandPortugalPost-demographic dividendPre-demographic dividendPuerto RicoQatarRomaniaRussian FederationRwandaSamoaSao Tome and PrincipeSaudi ArabiaSenegalSerbiaSeychellesSierra LeoneSingaporeSlovak RepublicSloveniaSmall statesSolomon IslandsSomaliaSouth AfricaSouth AsiaSouth Asia (IDA & IBRD)SpainSri LankaSt. Kitts and NevisSt. LuciaSt. Vincent and the GrenadinesSub-Saharan Africa Sub-Saharan Africa (excluding high income)Sub-Saharan Africa (IDA & IBRD countries)SudanSurinameSwazilandSwedenSwitzerlandSyrian Arab RepublicTajikistanTanzaniaThailandTimor-LesteTogoTongaTrinidad and TobagoTunisiaTurkeyTurkmenistanTurks and Caicos IslandsTuvaluUgandaUkraineUnited Arab EmiratesUnited KingdomUnited StatesUpper middle incomeUruguayUzbekistanVanuatuVenezuela, RBVietnamVirgin Islands (U.S.)WorldYemen, Rep.ZambiaZimbabwe Linha do tempo:
Nesta escala de tempo está apresentado um gráfico de 1971 ano até 2009 ano Oman. Dados de 1970 ano ausente. O número de observações reais por data: 39.
Fonte (nome):
Indicadores de desenvolvimento mundial
Fonte (organização):
World Bank staff estimates from original source: European Commission, Joint Research Centre (JRC)/Netherlands Environmental Assessment Agency (PBL). Emission Database for Global Atmospheric Research (EDGAR): http://edgar.jrc.ec.europa.eu/.
Categorias:
Agriculture & Rural Development, Environment
Foi atualizado:
23 abr 2017 ano
Indicadores de alterações dos valores ao longo dos anos
Mínimo:
1.065
1 jan 1976 ano
Máximo:
6.903
1 jan 1986 ano
Na data de observação
Valor
Mudança absoluta
A alteração em relação ao valor anterior
1 jan 1971 ano
1.948
+1.948
0.0%
1 jan 1972 ano
2.042
+0.093
4.8%
1 jan 1973 ano
2.293
+0.251
12.29%
1 jan 1974 ano
2.572
+0.28
12.19%
1 jan 1975 ano
2.864
+0.292
11.34%
1 jan 1976 ano
1.065
-1.799
-62.82%
1 jan 1977 ano
1.085
+0.02
1.86%
1 jan 1978 ano
1.206
+0.121
11.16%
1 jan 1979 ano
1.56
+0.354
29.4%
1 jan 1980 ano
1.881
+0.321
20.57%
1 jan 1981 ano
3.46
+1.579
83.94%
1 jan 1982 ano
3.296
-0.164
-4.75%
1 jan 1983 ano
3.965
+0.669
20.3%
1 jan 1984 ano
3.757
-0.208
-5.25%
1 jan 1985 ano
4.739
+0.983
26.16%
1 jan 1986 ano
6.903
+2.164
45.65%
1 jan 1987 ano
5.72
-1.183
-17.14%
1 jan 1988 ano
5.927
+0.207
3.62%
1 jan 1989 ano
5.266
-0.661
-11.15%
1 jan 1990 ano
5.348
+0.081
1.55%
1 jan 1991 ano
4.955
-0.392
-7.34%
1 jan 1992 ano
5.361
+0.406
8.19%
1 jan 1993 ano
5.477
+0.115
2.15%
1 jan 1994 ano
5.559
+0.083
1.51%
1 jan 1995 ano
6.177
+0.617
11.1%
1 jan 1996 ano
5.921
-0.256
-4.14%
1 jan 1997 ano
5.829
-0.092
-1.55%
1 jan 1998 ano
5.543
-0.286
-4.9%
1 jan 1999 ano
5.829
+0.285
5.15%
1 jan 2000 ano
5.716
-0.112
-1.93%
1 jan 2001 ano
4.774
-0.942
-16.48%
1 jan 2002 ano
4.156
-0.618
-12.94%
1 jan 2003 ano
3.971
-0.185
-4.45%
1 jan 2004 ano
3.746
-0.225
-5.67%
1 jan 2005 ano
3.741
-0.005
-0.14%
1 jan 2006 ano
3.654
-0.087
-2.32%
1 jan 2007 ano
3.501
-0.153
-4.19%
1 jan 2008 ano
3.555
+0.054
1.53%
1 jan 2009 ano
3.498
-0.057
-1.6%
Classificação de países por estatísticas atuais por anos


Comentários: