30
/pt/
AIzaSyAYiBZKx7MnpbEhh9jyipgxe19OcubqV5w
April 1, 2024
286341
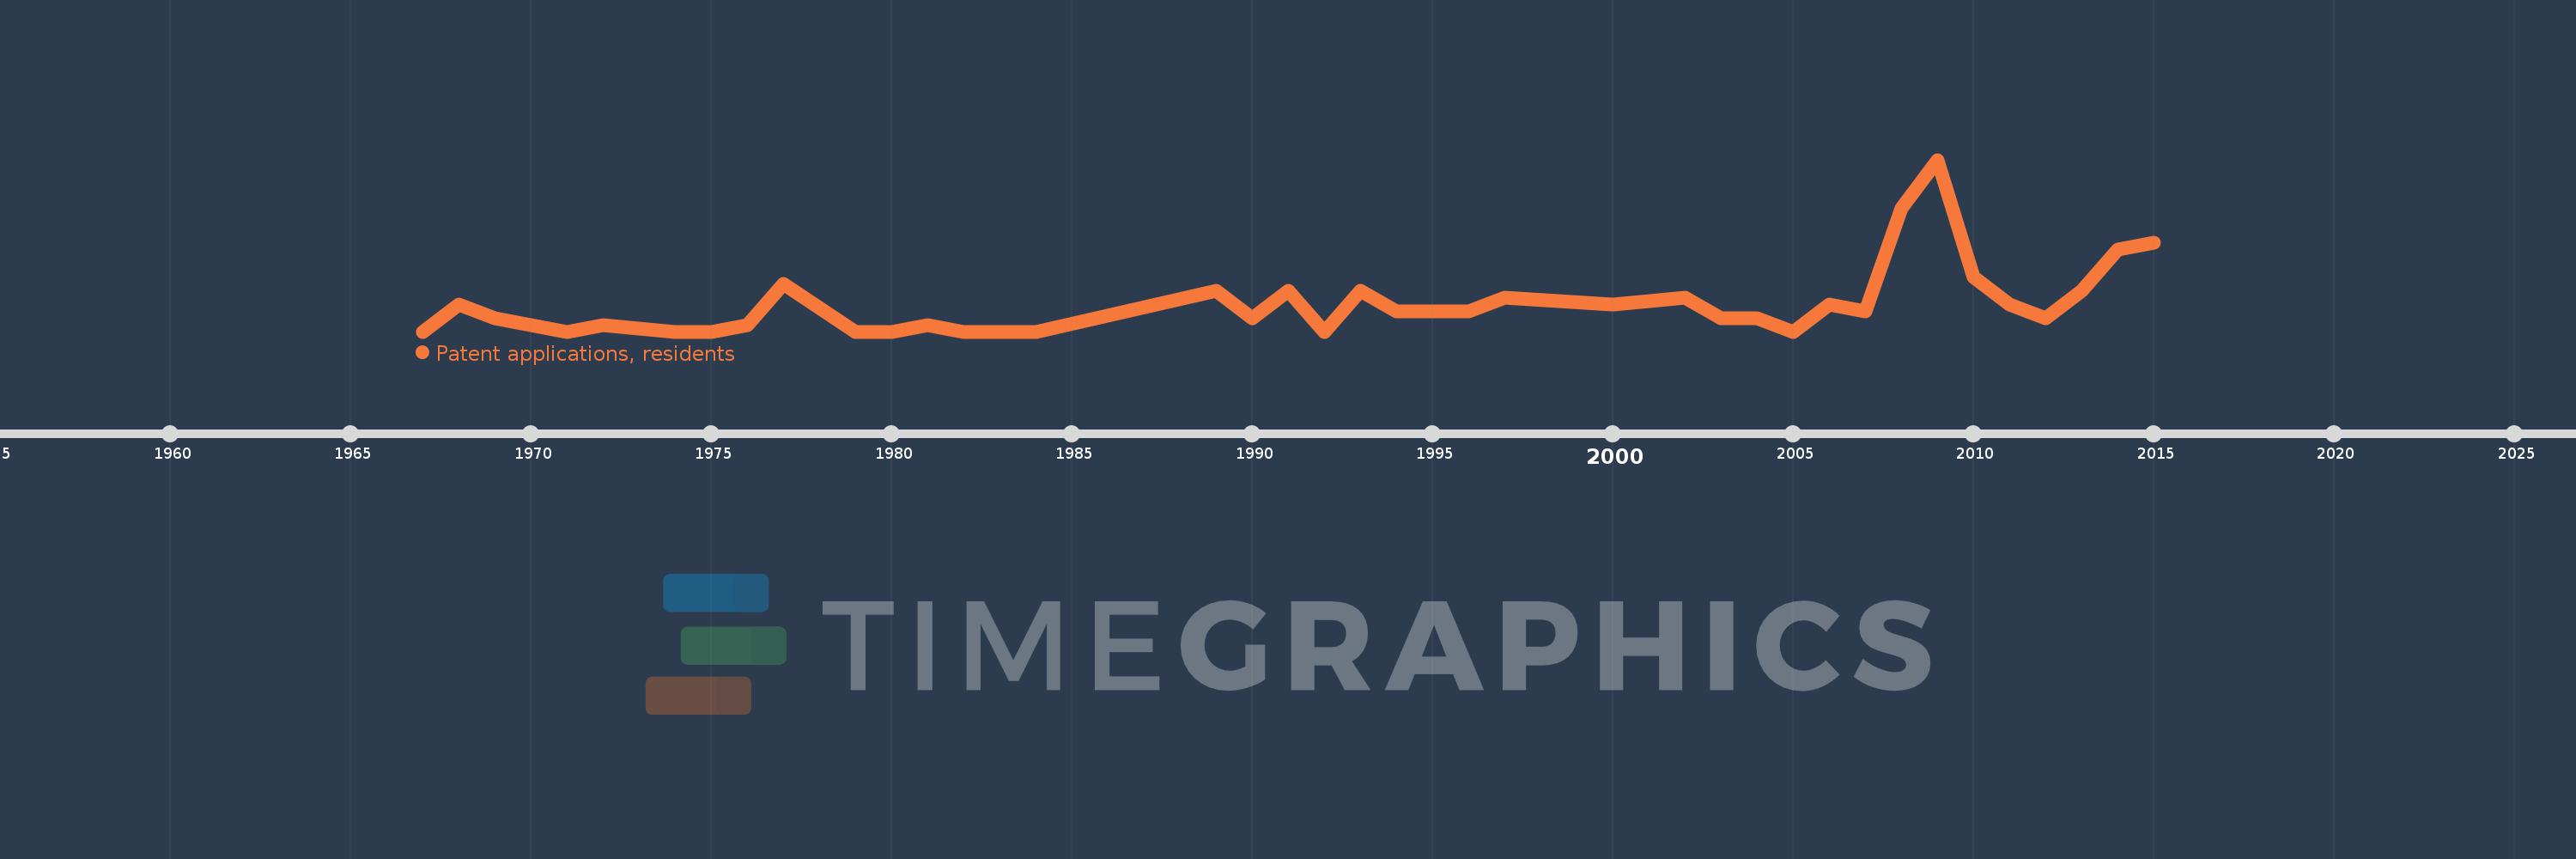
Zambia
ZMB
true
2
1
Patent applications, residents
2015,2014,2013,2012,2011,2010,2009,2008,2007,2006,2005,2004,2003,2002,2000,1997,1996,1994,1993,1992,1991,1990,1989,1984,1983,1982,1981,1980,1979,1977,1976,1975,1974,1972,1971,1970,1969,1968,1967
