29
/pt/
pt
AIzaSyAYiBZKx7MnpbEhh9jyipgxe19OcubqV5w
April 1, 2024
222661
Peru
PER
true
2
1
Patent applications, residents
2015,2014,2013,2012,2011,2010,2009,2008,2007,2006,2005,2004,2003,2002,2001,2000,1998,1997,1995,1994,1993,1992,1991,1989,1988,1987,1986,1984,1983,1982,1981,1980,1979,1978,1976,1974,1973
Estas estatísticas em outros países:
AlbaniaAlgeriaAngolaArab WorldArgentinaArmeniaArubaAustraliaAustriaAzerbaijanBahamas, TheBahrainBangladeshBarbadosBelarusBelgiumBelizeBhutanBoliviaBosnia and HerzegovinaBotswanaBrazilBrunei DarussalamBulgariaBurkina FasoBurundiCambodiaCanadaCaribbean small statesCentral Europe and the BalticsChileChinaColombiaCongo, Dem. Rep.Congo, Rep.Costa RicaCote d'IvoireCroatiaCubaCyprusCzech RepublicDenmarkDjiboutiDominican RepublicEarly-demographic dividendEast Asia & PacificEast Asia & Pacific (excluding high income)East Asia & Pacific (IDA & IBRD countries)EcuadorEgypt, Arab Rep.El SalvadorEstoniaEthiopiaEuro areaEurope & Central AsiaEurope & Central Asia (excluding high income)Europe & Central Asia (IDA & IBRD countries)European UnionFijiFinlandFranceGeorgiaGermanyGreeceGuatemalaGuyanaHaitiHigh incomeHondurasHong Kong SAR, ChinaHungaryIBRD onlyIcelandIDA & IBRD totalIDA blendIndiaIndonesiaIran, Islamic Rep.IraqIrelandIsraelItalyJamaicaJapanJordanKazakhstanKenyaKiribatiKorea, Dem. People’s Rep.Korea, Rep.KuwaitKyrgyz RepublicLao PDRLate-demographic dividendLatin America & Caribbean Latin America & Caribbean (excluding high income)Latin America & the Caribbean (IDA & IBRD countries)LatviaLebanonLesothoLiberiaLibyaLithuaniaLow & middle incomeLower middle incomeLuxembourgMacao SAR, ChinaMacedonia, FYRMadagascarMalawiMalaysiaMaliMaltaMauritiusMexicoMiddle East & North AfricaMiddle East & North Africa (excluding high income)Middle East & North Africa (IDA & IBRD countries)Middle incomeMoldovaMonacoMongoliaMontenegroMoroccoMozambiqueNamibiaNepalNetherlandsNew ZealandNicaraguaNigeriaNorth AmericaNorwayOECD membersPakistanPanamaPapua New GuineaParaguayPeruPhilippinesPolandPortugalPost-demographic dividendQatarRomaniaRussian FederationRwandaSamoaSaudi ArabiaSerbiaSierra LeoneSingaporeSlovak RepublicSloveniaSomaliaSouth AfricaSouth AsiaSouth Asia (IDA & IBRD)SpainSri LankaSudanSwazilandSwedenSwitzerlandSyrian Arab RepublicTajikistanTanzaniaThailandTrinidad and TobagoTunisiaTurkeyTurkmenistanUgandaUkraineUnited Arab EmiratesUnited KingdomUnited StatesUpper middle incomeUruguayUzbekistanVenezuela, RBVietnamWorldYemen, Rep.ZambiaZimbabwe Linha do tempo:
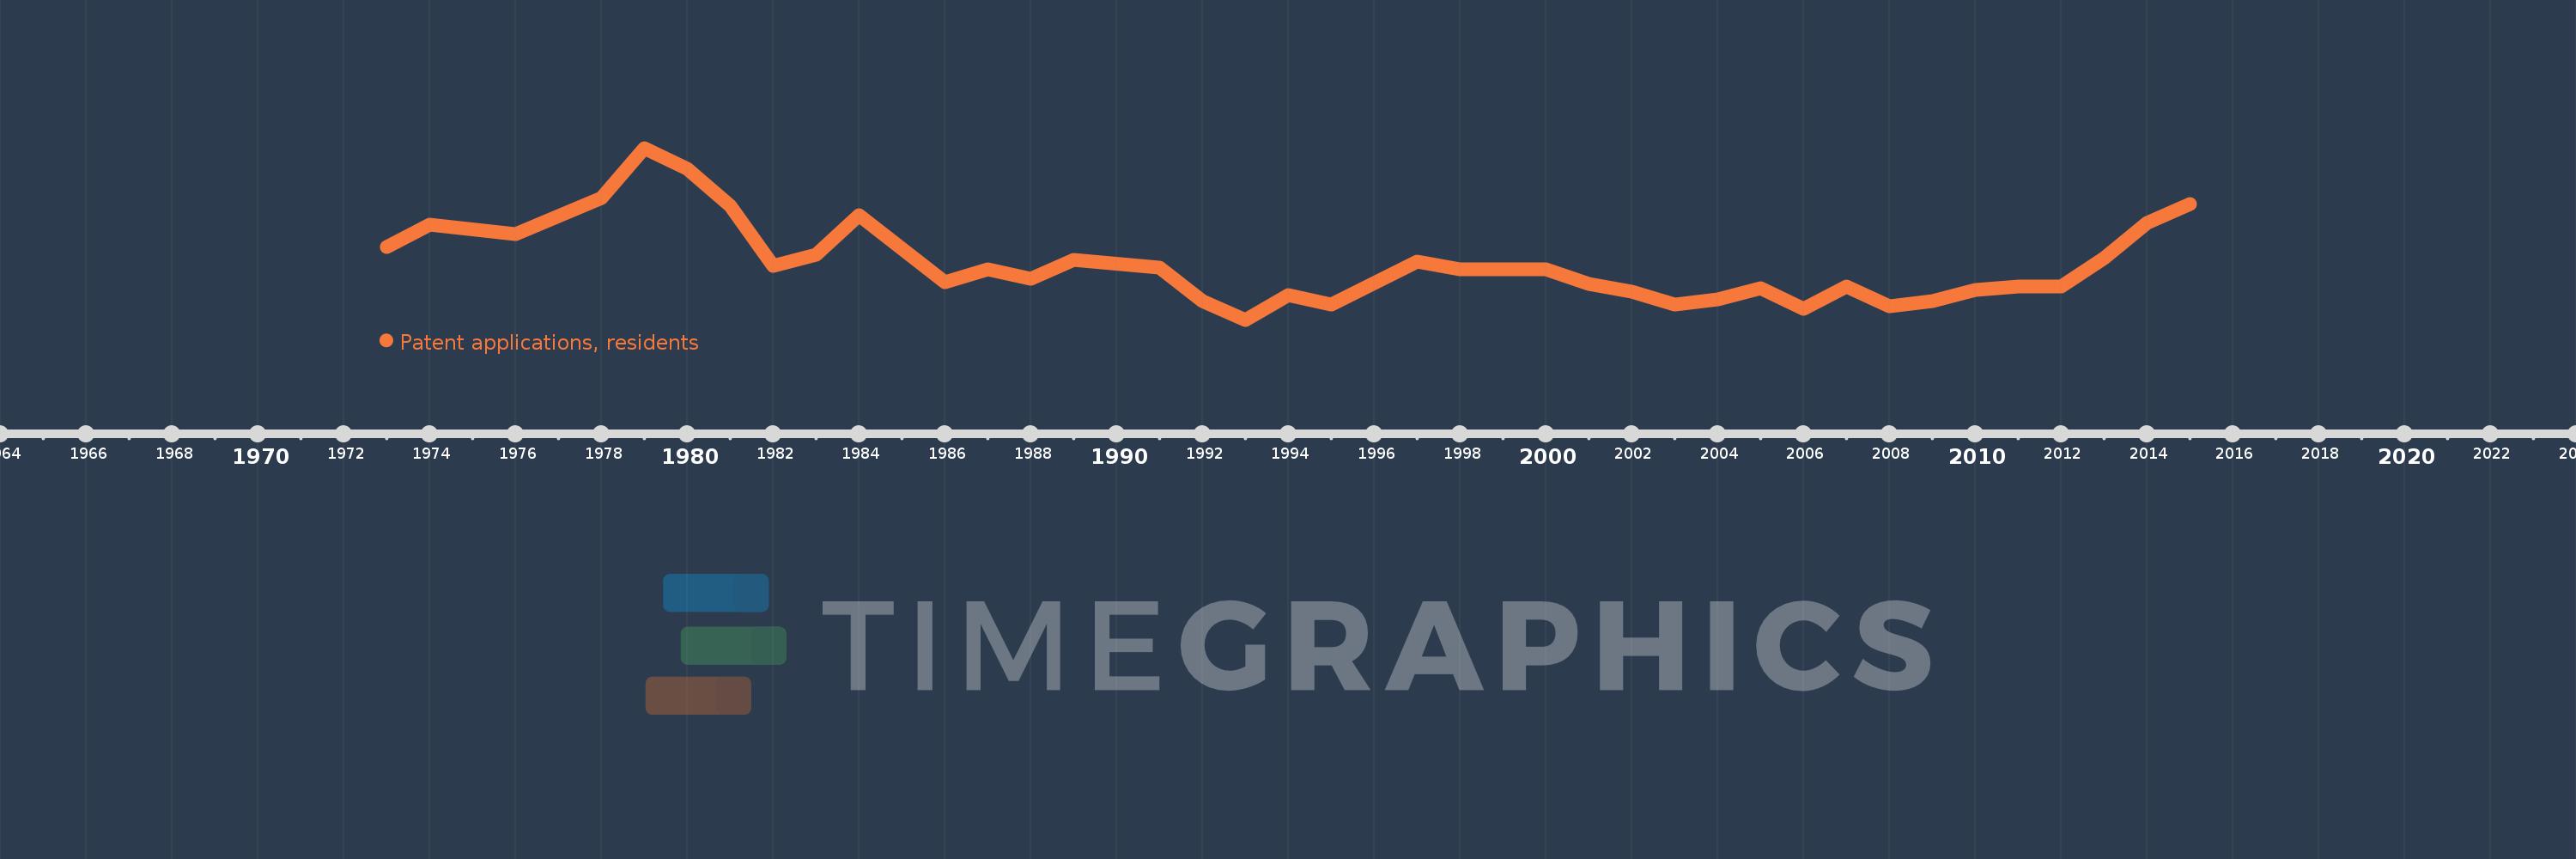
Nesta escala de tempo está apresentado um gráfico de 1973 ano até 2015 ano Peru. Dados de 1972 ano ausente. O número de observações reais por data: 37.
Fonte (nome):
Indicadores de desenvolvimento mundial
Fonte (organização):
World Intellectual Property Organization (WIPO), WIPO Patent Report: Statistics on Worldwide Patent Activity. The International Bureau of WIPO assumes no responsibility with respect to the transformation of these data.
Categorias:
Science & Technology
Foi atualizado:
23 abr 2017 ano
Indicadores de alterações dos valores ao longo dos anos
Mínimo:
21.0
1 jan 1993 ano
Máximo:
113.0
1 jan 1979 ano
Na data de observação
Valor
Mudança absoluta
A alteração em relação ao valor anterior
1 jan 1973 ano
60.0
+60.0
0.0%
1 jan 1974 ano
72.0
+12.0
20.0%
1 jan 1976 ano
67.0
-5.0
-6.94%
1 jan 1978 ano
86.0
+19.0
28.36%
1 jan 1979 ano
113.0
+27.0
31.4%
1 jan 1980 ano
102.0
-11.0
-9.73%
1 jan 1981 ano
82.0
-20.0
-19.61%
1 jan 1982 ano
50.0
-32.0
-39.02%
1 jan 1983 ano
56.0
+6.0
12.0%
1 jan 1984 ano
77.0
+21.0
37.5%
1 jan 1986 ano
41.0
-36.0
-46.75%
1 jan 1987 ano
48.0
+7.0
17.07%
1 jan 1988 ano
43.0
-5.0
-10.42%
1 jan 1989 ano
53.0
+10.0
23.26%
1 jan 1991 ano
49.0
-4.0
-7.55%
1 jan 1992 ano
31.0
-18.0
-36.73%
1 jan 1993 ano
21.0
-10.0
-32.26%
1 jan 1994 ano
34.0
+13.0
61.9%
1 jan 1995 ano
29.0
-5.0
-14.71%
1 jan 1997 ano
52.0
+23.0
79.31%
1 jan 1998 ano
48.0
-4.0
-7.69%
1 jan 2000 ano
48.0
0.0
0.0%
1 jan 2001 ano
40.0
-8.0
-16.67%
1 jan 2002 ano
36.0
-4.0
-10.0%
1 jan 2003 ano
29.0
-7.0
-19.44%
1 jan 2004 ano
32.0
+3.0
10.34%
1 jan 2005 ano
38.0
+6.0
18.75%
1 jan 2006 ano
27.0
-11.0
-28.95%
1 jan 2007 ano
39.0
+12.0
44.44%
1 jan 2008 ano
28.0
-11.0
-28.21%
1 jan 2009 ano
31.0
+3.0
10.71%
1 jan 2010 ano
37.0
+6.0
19.35%
1 jan 2011 ano
39.0
+2.0
5.41%
1 jan 2012 ano
39.0
0.0
0.0%
1 jan 2013 ano
54.0
+15.0
38.46%
1 jan 2014 ano
73.0
+19.0
35.19%
1 jan 2015 ano
83.0
+10.0
13.7%
Classificação de países por estatísticas atuais por anos


Comentários: