29
/pt/
pt
AIzaSyAYiBZKx7MnpbEhh9jyipgxe19OcubqV5w
April 1, 2024
285772
Zambia
ZMB
true
2
1
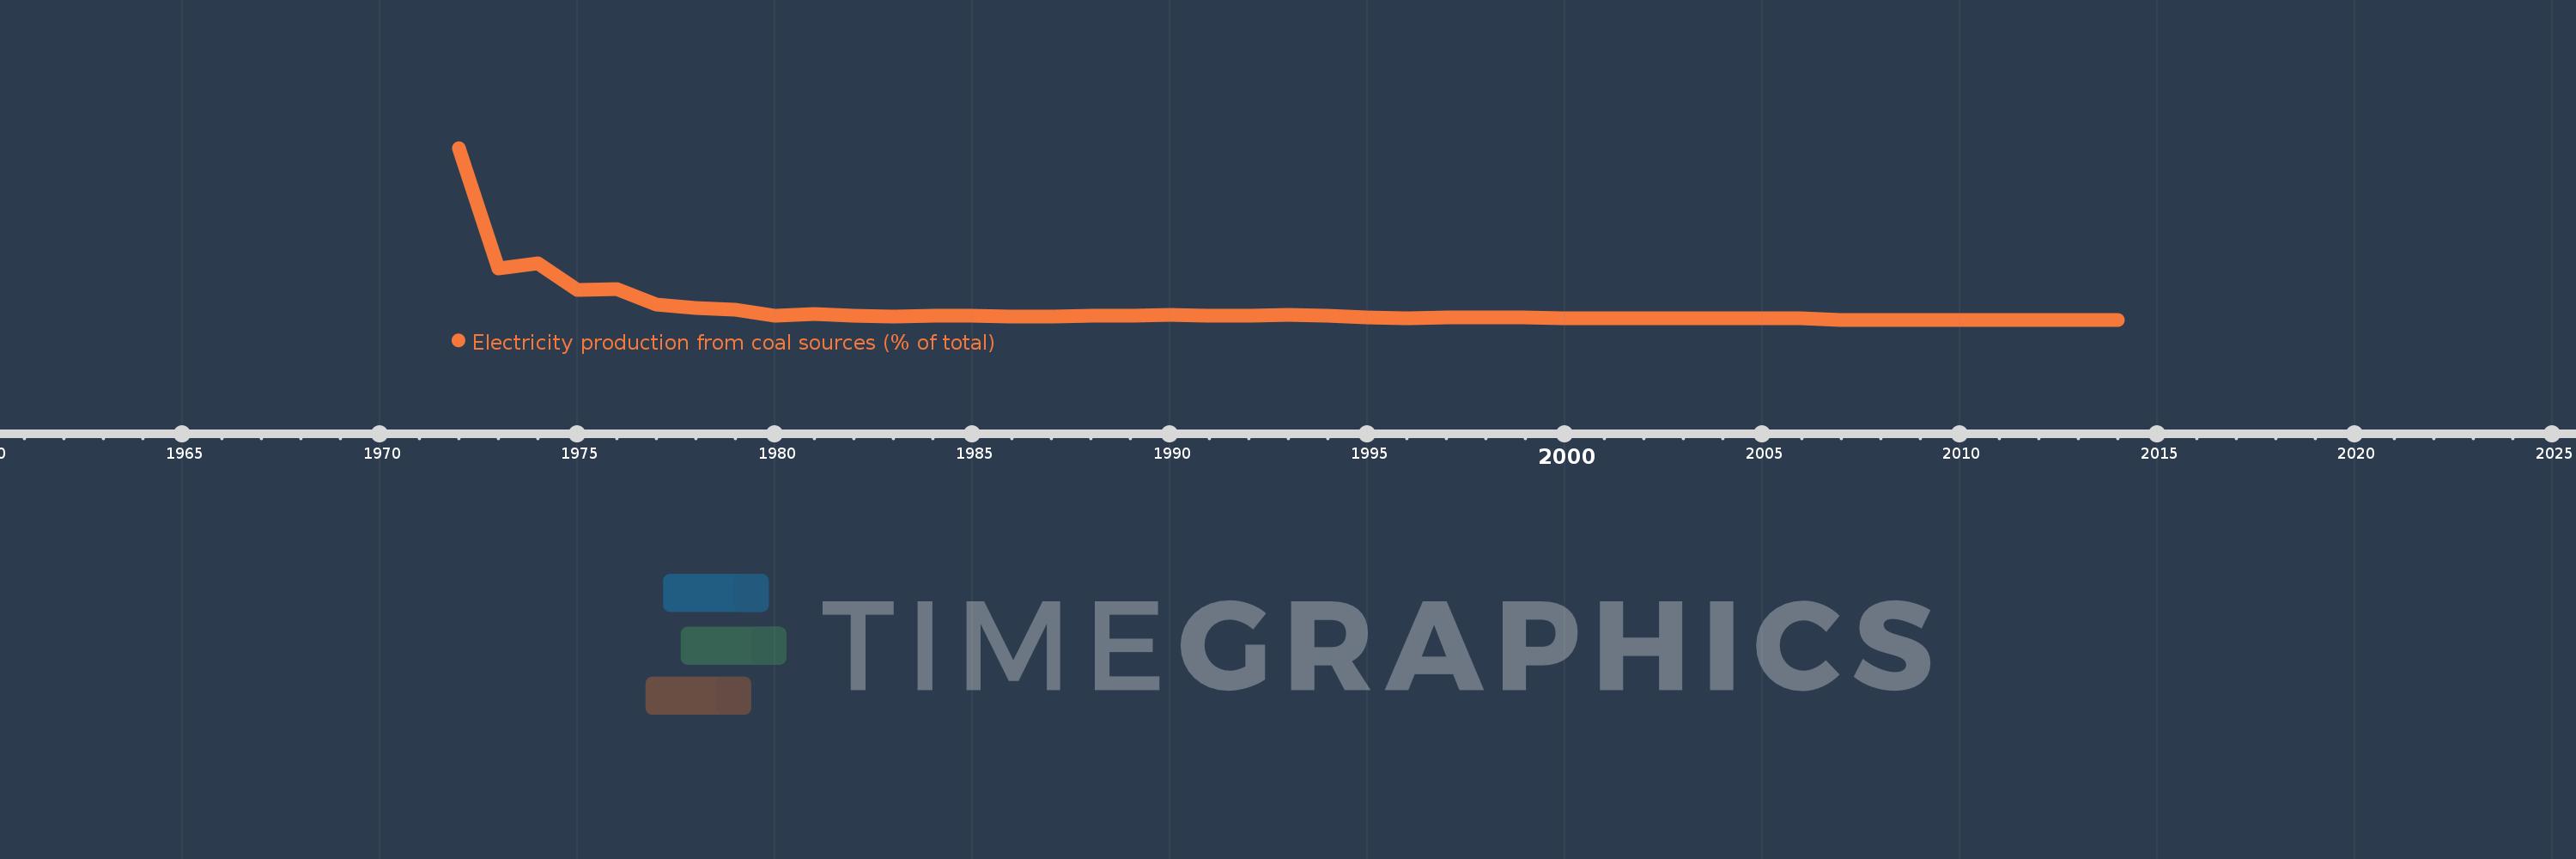
Electricity production from coal sources (% of total)
2014,2013,2012,2011,2010,2009,2008,2007,2006,2005,2004,2003,2002,2001,2000,1999,1998,1997,1996,1995,1994,1993,1992,1991,1990,1989,1988,1987,1986,1985,1984,1983,1982,1981,1980,1979,1978,1977,1976,1975,1974,1973,1972
Estas estatísticas em outros países:
AlbaniaAlgeriaAngolaArab WorldArgentinaArmeniaAustraliaAustriaAzerbaijanBahrainBangladeshBelarusBelgiumBeninBoliviaBosnia and HerzegovinaBotswanaBrazilBrunei DarussalamBulgariaCambodiaCameroonCanadaCentral Europe and the BalticsChileChinaColombiaCongo, Dem. Rep.Congo, Rep.Costa RicaCote d'IvoireCroatiaCubaCuracaoCyprusCzech RepublicDenmarkDominican RepublicEarly-demographic dividendEast Asia & PacificEast Asia & Pacific (excluding high income)East Asia & Pacific (IDA & IBRD countries)EcuadorEgypt, Arab Rep.El SalvadorEritreaEstoniaEthiopiaEuro areaEurope & Central AsiaEurope & Central Asia (excluding high income)Europe & Central Asia (IDA & IBRD countries)European UnionFinlandFragile and conflict affected situationsFranceGabonGeorgiaGermanyGhanaGibraltarGreeceGuatemalaHaitiHeavily indebted poor countries (HIPC)High incomeHondurasHong Kong SAR, ChinaHungaryIBRD onlyIcelandIDA & IBRD totalIDA blendIDA onlyIDA totalIndiaIndonesiaIran, Islamic Rep.IraqIrelandIsraelItalyJamaicaJapanJordanKazakhstanKenyaKorea, Dem. People’s Rep.Korea, Rep.KosovoKuwaitKyrgyz RepublicLate-demographic dividendLatin America & Caribbean Latin America & Caribbean (excluding high income)Latin America & the Caribbean (IDA & IBRD countries)LatviaLeast developed countries: UN classificationLebanonLibyaLithuaniaLow & middle incomeLower middle incomeLuxembourgMacedonia, FYRMalaysiaMaltaMauritiusMexicoMiddle East & North AfricaMiddle East & North Africa (excluding high income)Middle East & North Africa (IDA & IBRD countries)Middle incomeMoldovaMongoliaMontenegroMoroccoMozambiqueMyanmarNamibiaNepalNetherlandsNew ZealandNicaraguaNigerNigeriaNorth AmericaNorwayOECD membersOmanOther small statesPakistanPanamaParaguayPeruPhilippinesPolandPortugalPost-demographic dividendPre-demographic dividendQatarRomaniaRussian FederationSaudi ArabiaSenegalSerbiaSingaporeSlovak RepublicSloveniaSmall statesSouth AfricaSouth AsiaSouth Asia (IDA & IBRD)South SudanSpainSri LankaSub-Saharan Africa Sub-Saharan Africa (excluding high income)Sub-Saharan Africa (IDA & IBRD countries)SudanSwedenSwitzerlandSyrian Arab RepublicTajikistanTanzaniaThailandTogoTrinidad and TobagoTunisiaTurkeyTurkmenistanUkraineUnited Arab EmiratesUnited KingdomUnited StatesUpper middle incomeUruguayUzbekistanVenezuela, RBVietnamWorldYemen, Rep.ZambiaZimbabwe Linha do tempo:
Nesta escala de tempo está apresentado um gráfico de 1972 ano até 2014 ano Zambia. Dados de 1971 ano ausente. O número de observações reais por data: 43.
Fonte (nome):
Indicadores de desenvolvimento mundial
Fonte (organização):
IEA Statistics © OECD/IEA 2014 (http://www.iea.org/stats/index.asp), subject to https://www.iea.org/t&c/termsandconditions/
Categorias:
Energy & Mining, Climate Change, Infrastructure
Foi atualizado:
23 abr 2017 ano
Indicadores de alterações dos valores ao longo dos anos
Máximo:
20.313
1 jan 1972 ano
Na data de observação
Valor
Mudança absoluta
A alteração em relação ao valor anterior
1 jan 1972 ano
20.313
+20.313
0.0%
1 jan 1973 ano
6.027
-14.285
-70.33%
1 jan 1974 ano
6.71
+0.683
11.33%
1 jan 1975 ano
3.488
-3.223
-48.03%
1 jan 1976 ano
3.599
+0.112
3.21%
1 jan 1977 ano
1.783
-1.816
-50.45%
1 jan 1978 ano
1.358
-0.426
-23.87%
1 jan 1979 ano
1.149
-0.208
-15.35%
1 jan 1980 ano
0.5
-0.649
-56.5%
1 jan 1981 ano
0.677
+0.178
35.51%
1 jan 1982 ano
0.477
-0.201
-29.64%
1 jan 1983 ano
0.344
-0.133
-27.83%
1 jan 1984 ano
0.438
+0.094
27.32%
1 jan 1985 ano
0.492
+0.055
12.45%
1 jan 1986 ano
0.357
-0.135
-27.41%
1 jan 1987 ano
0.368
+0.01
2.86%
1 jan 1988 ano
0.444
+0.076
20.7%
1 jan 1989 ano
0.432
-0.012
-2.75%
1 jan 1990 ano
0.612
+0.181
41.87%
1 jan 1991 ano
0.487
-0.126
-20.52%
1 jan 1992 ano
0.464
-0.022
-4.62%
1 jan 1993 ano
0.623
+0.159
34.28%
1 jan 1994 ano
0.5
-0.123
-19.77%
1 jan 1995 ano
0.233
-0.267
-53.33%
1 jan 1996 ano
0.151
-0.082
-35.12%
1 jan 1997 ano
0.237
+0.086
56.67%
1 jan 1998 ano
0.302
+0.065
27.38%
1 jan 1999 ano
0.303
+0.0
0.09%
1 jan 2000 ano
0.18
-0.122
-40.39%
1 jan 2001 ano
0.18
-0.001
-0.44%
1 jan 2002 ano
0.189
+0.009
5.19%
1 jan 2003 ano
0.196
+0.007
3.92%
1 jan 2004 ano
0.205
+0.008
4.26%
1 jan 2005 ano
0.153
-0.052
-25.32%
1 jan 2006 ano
0.179
+0.026
17.18%
1 jan 2007 ano
0.0
-0.179
-100.0%
Classificação de países por estatísticas atuais por anos


Comentários: