29
/pt/
pt
AIzaSyAYiBZKx7MnpbEhh9jyipgxe19OcubqV5w
April 1, 2024
225788
Portugal
PRT
true
2
1
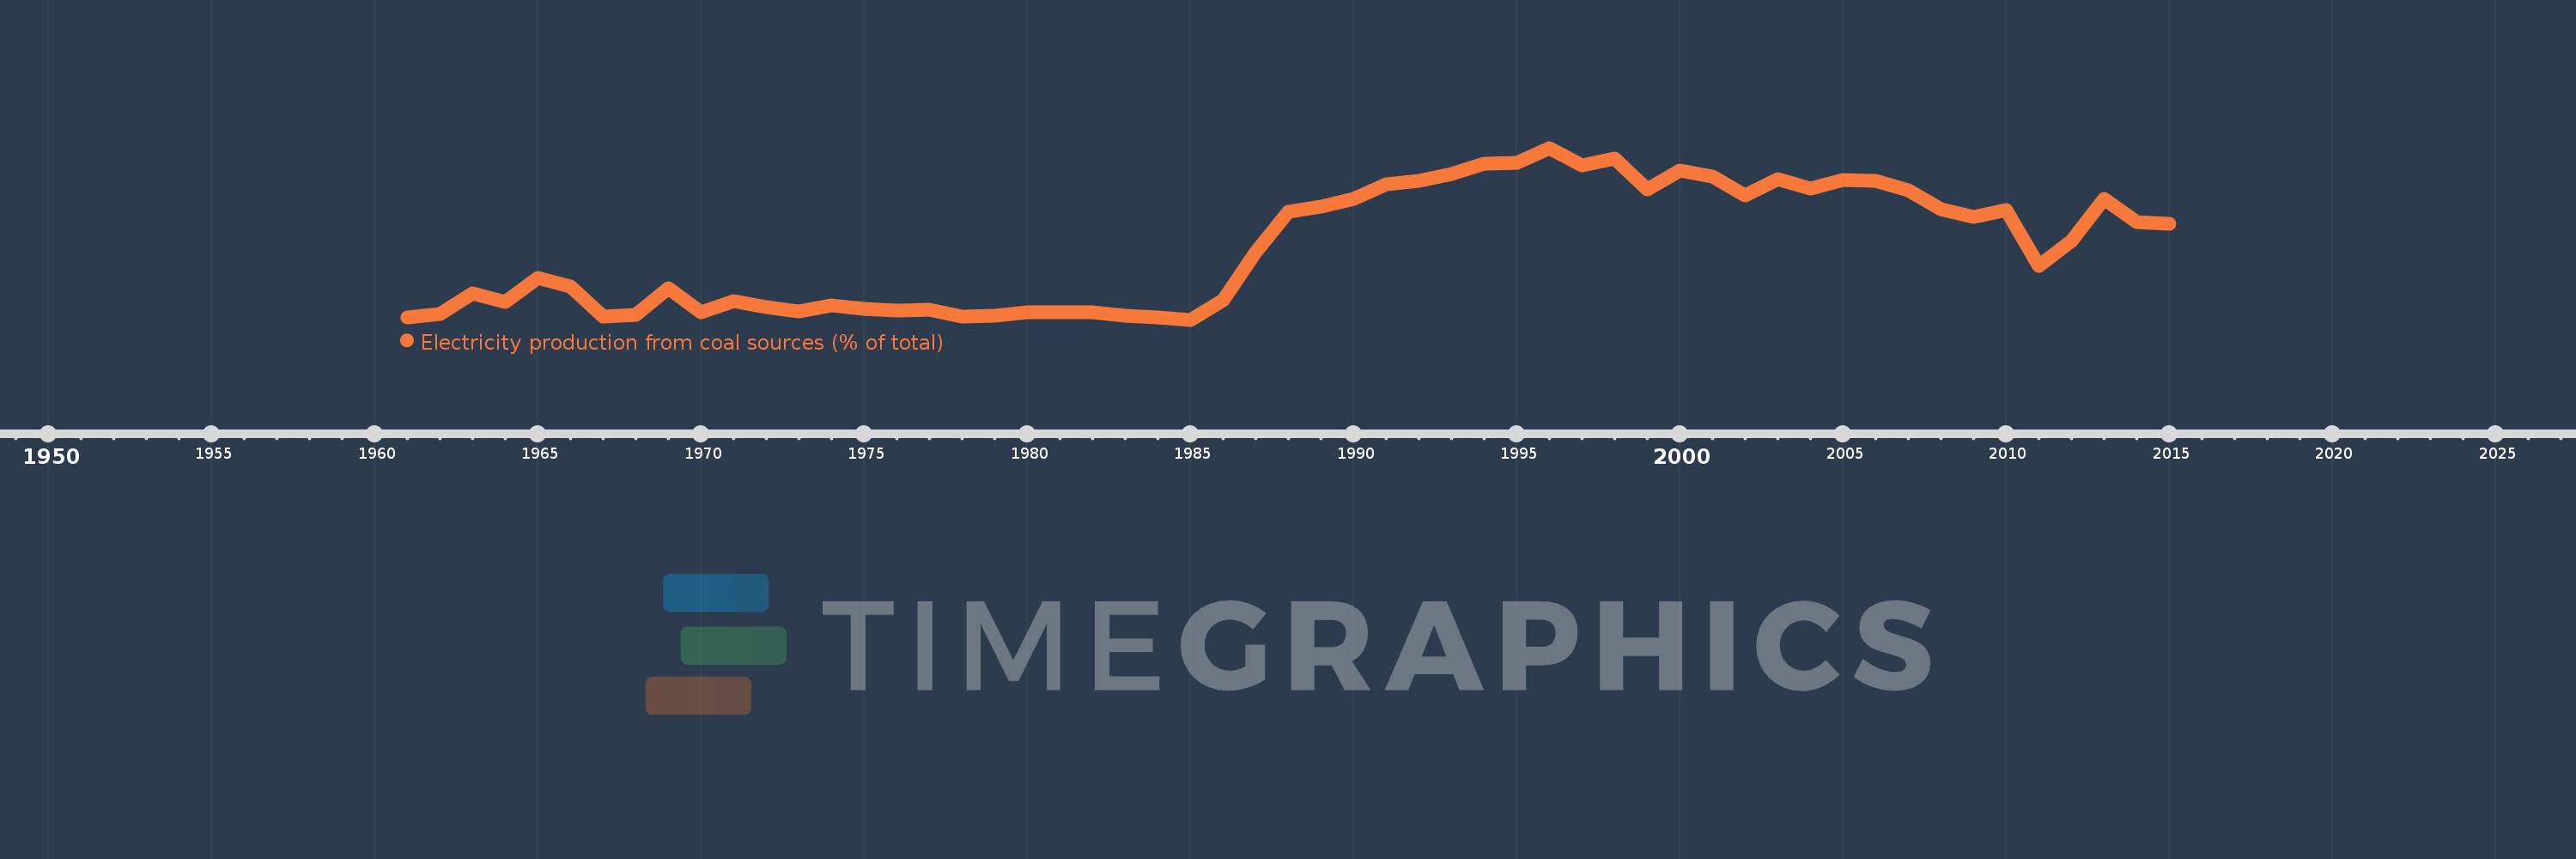
Electricity production from coal sources (% of total)
2015,2014,2013,2012,2011,2010,2009,2008,2007,2006,2005,2004,2003,2002,2001,2000,1999,1998,1997,1996,1995,1994,1993,1992,1991,1990,1989,1988,1987,1986,1985,1984,1983,1982,1981,1980,1979,1978,1977,1976,1975,1974,1973,1972,1971,1970,1969,1968,1967,1966,1965,1964,1963,1962,1961
Estas estatísticas em outros países:
AlbaniaAlgeriaAngolaArab WorldArgentinaArmeniaAustraliaAustriaAzerbaijanBahrainBangladeshBelarusBelgiumBeninBoliviaBosnia and HerzegovinaBotswanaBrazilBrunei DarussalamBulgariaCambodiaCameroonCanadaCentral Europe and the BalticsChileChinaColombiaCongo, Dem. Rep.Congo, Rep.Costa RicaCote d'IvoireCroatiaCubaCuracaoCyprusCzech RepublicDenmarkDominican RepublicEarly-demographic dividendEast Asia & PacificEast Asia & Pacific (excluding high income)East Asia & Pacific (IDA & IBRD countries)EcuadorEgypt, Arab Rep.El SalvadorEritreaEstoniaEthiopiaEuro areaEurope & Central AsiaEurope & Central Asia (excluding high income)Europe & Central Asia (IDA & IBRD countries)European UnionFinlandFragile and conflict affected situationsFranceGabonGeorgiaGermanyGhanaGibraltarGreeceGuatemalaHaitiHeavily indebted poor countries (HIPC)High incomeHondurasHong Kong SAR, ChinaHungaryIBRD onlyIcelandIDA & IBRD totalIDA blendIDA onlyIDA totalIndiaIndonesiaIran, Islamic Rep.IraqIrelandIsraelItalyJamaicaJapanJordanKazakhstanKenyaKorea, Dem. People’s Rep.Korea, Rep.KosovoKuwaitKyrgyz RepublicLate-demographic dividendLatin America & Caribbean Latin America & Caribbean (excluding high income)Latin America & the Caribbean (IDA & IBRD countries)LatviaLeast developed countries: UN classificationLebanonLibyaLithuaniaLow & middle incomeLower middle incomeLuxembourgMacedonia, FYRMalaysiaMaltaMauritiusMexicoMiddle East & North AfricaMiddle East & North Africa (excluding high income)Middle East & North Africa (IDA & IBRD countries)Middle incomeMoldovaMongoliaMontenegroMoroccoMozambiqueMyanmarNamibiaNepalNetherlandsNew ZealandNicaraguaNigerNigeriaNorth AmericaNorwayOECD membersOmanOther small statesPakistanPanamaParaguayPeruPhilippinesPolandPortugalPost-demographic dividendPre-demographic dividendQatarRomaniaRussian FederationSaudi ArabiaSenegalSerbiaSingaporeSlovak RepublicSloveniaSmall statesSouth AfricaSouth AsiaSouth Asia (IDA & IBRD)South SudanSpainSri LankaSub-Saharan Africa Sub-Saharan Africa (excluding high income)Sub-Saharan Africa (IDA & IBRD countries)SudanSwedenSwitzerlandSyrian Arab RepublicTajikistanTanzaniaThailandTogoTrinidad and TobagoTunisiaTurkeyTurkmenistanUkraineUnited Arab EmiratesUnited KingdomUnited StatesUpper middle incomeUruguayUzbekistanVenezuela, RBVietnamWorldYemen, Rep.ZambiaZimbabwe Linha do tempo:
Nesta escala de tempo está apresentado um gráfico de 1961 ano até 2015 ano Portugal. Dados de 1960 ano ausente. O número de observações reais por data: 55.
Fonte (nome):
Indicadores de desenvolvimento mundial
Fonte (organização):
IEA Statistics © OECD/IEA 2014 (http://www.iea.org/stats/index.asp), subject to https://www.iea.org/t&c/termsandconditions/
Categorias:
Energy & Mining, Climate Change, Infrastructure
Foi atualizado:
23 abr 2017 ano
Indicadores de alterações dos valores ao longo dos anos
Mínimo:
0.63
1 jan 1985 ano
Máximo:
40.586
1 jan 1996 ano
Na data de observação
Valor
Mudança absoluta
A alteração em relação ao valor anterior
1 jan 1961 ano
1.098
+1.098
0.0%
1 jan 1962 ano
1.895
+0.797
72.56%
1 jan 1963 ano
6.741
+4.846
255.79%
1 jan 1964 ano
4.809
-1.932
-28.66%
1 jan 1965 ano
10.309
+5.5
114.37%
1 jan 1966 ano
8.276
-2.033
-19.72%
1 jan 1967 ano
1.38
-6.896
-83.33%
1 jan 1968 ano
1.682
+0.302
21.9%
1 jan 1969 ano
7.941
+6.259
372.18%
1 jan 1970 ano
2.275
-5.666
-71.35%
1 jan 1971 ano
4.934
+2.659
116.85%
1 jan 1972 ano
3.559
-1.375
-27.87%
1 jan 1973 ano
2.489
-1.07
-30.07%
1 jan 1974 ano
3.942
+1.453
58.4%
1 jan 1975 ano
3.201
-0.741
-18.8%
1 jan 1976 ano
2.775
-0.425
-13.29%
1 jan 1977 ano
2.946
+0.171
6.16%
1 jan 1978 ano
1.466
-1.48
-50.23%
1 jan 1979 ano
1.596
+0.13
8.84%
1 jan 1980 ano
2.271
+0.675
42.3%
1 jan 1981 ano
2.295
+0.024
1.06%
1 jan 1982 ano
2.416
+0.121
5.27%
1 jan 1983 ano
1.615
-0.801
-33.16%
1 jan 1984 ano
1.268
-0.346
-21.45%
1 jan 1985 ano
0.63
-0.638
-50.31%
1 jan 1986 ano
5.136
+4.505
714.69%
1 jan 1987 ano
16.402
+11.266
219.38%
1 jan 1988 ano
25.752
+9.351
57.01%
1 jan 1989 ano
26.905
+1.152
4.47%
1 jan 1990 ano
28.725
+1.821
6.77%
1 jan 1991 ano
32.107
+3.382
11.77%
1 jan 1992 ano
32.99
+0.883
2.75%
1 jan 1993 ano
34.579
+1.588
4.81%
1 jan 1994 ano
36.953
+2.374
6.87%
1 jan 1995 ano
37.166
+0.213
0.58%
1 jan 1996 ano
40.586
+3.421
9.2%
1 jan 1997 ano
36.581
-4.005
-9.87%
1 jan 1998 ano
38.201
+1.62
4.43%
1 jan 1999 ano
30.979
-7.221
-18.9%
1 jan 2000 ano
35.236
+4.257
13.74%
1 jan 2001 ano
33.865
-1.371
-3.89%
1 jan 2002 ano
29.505
-4.36
-12.87%
1 jan 2003 ano
33.323
+3.818
12.94%
1 jan 2004 ano
31.227
-2.096
-6.29%
1 jan 2005 ano
33.145
+1.918
6.14%
1 jan 2006 ano
32.965
-0.18
-0.54%
1 jan 2007 ano
30.793
-2.172
-6.59%
1 jan 2008 ano
26.437
-4.356
-14.15%
1 jan 2009 ano
24.622
-1.815
-6.87%
1 jan 2010 ano
26.062
+1.44
5.85%
1 jan 2011 ano
13.224
-12.838
-49.26%
1 jan 2012 ano
18.979
+5.756
43.52%
1 jan 2013 ano
28.715
+9.735
51.29%
1 jan 2014 ano
23.426
-5.289
-18.42%
1 jan 2015 ano
23.033
-0.393
-1.68%
Classificação de países por estatísticas atuais por anos


Comentários: