29
/pt/
pt
AIzaSyAYiBZKx7MnpbEhh9jyipgxe19OcubqV5w
April 1, 2024
285646
Zambia
ZMB
true
2
1
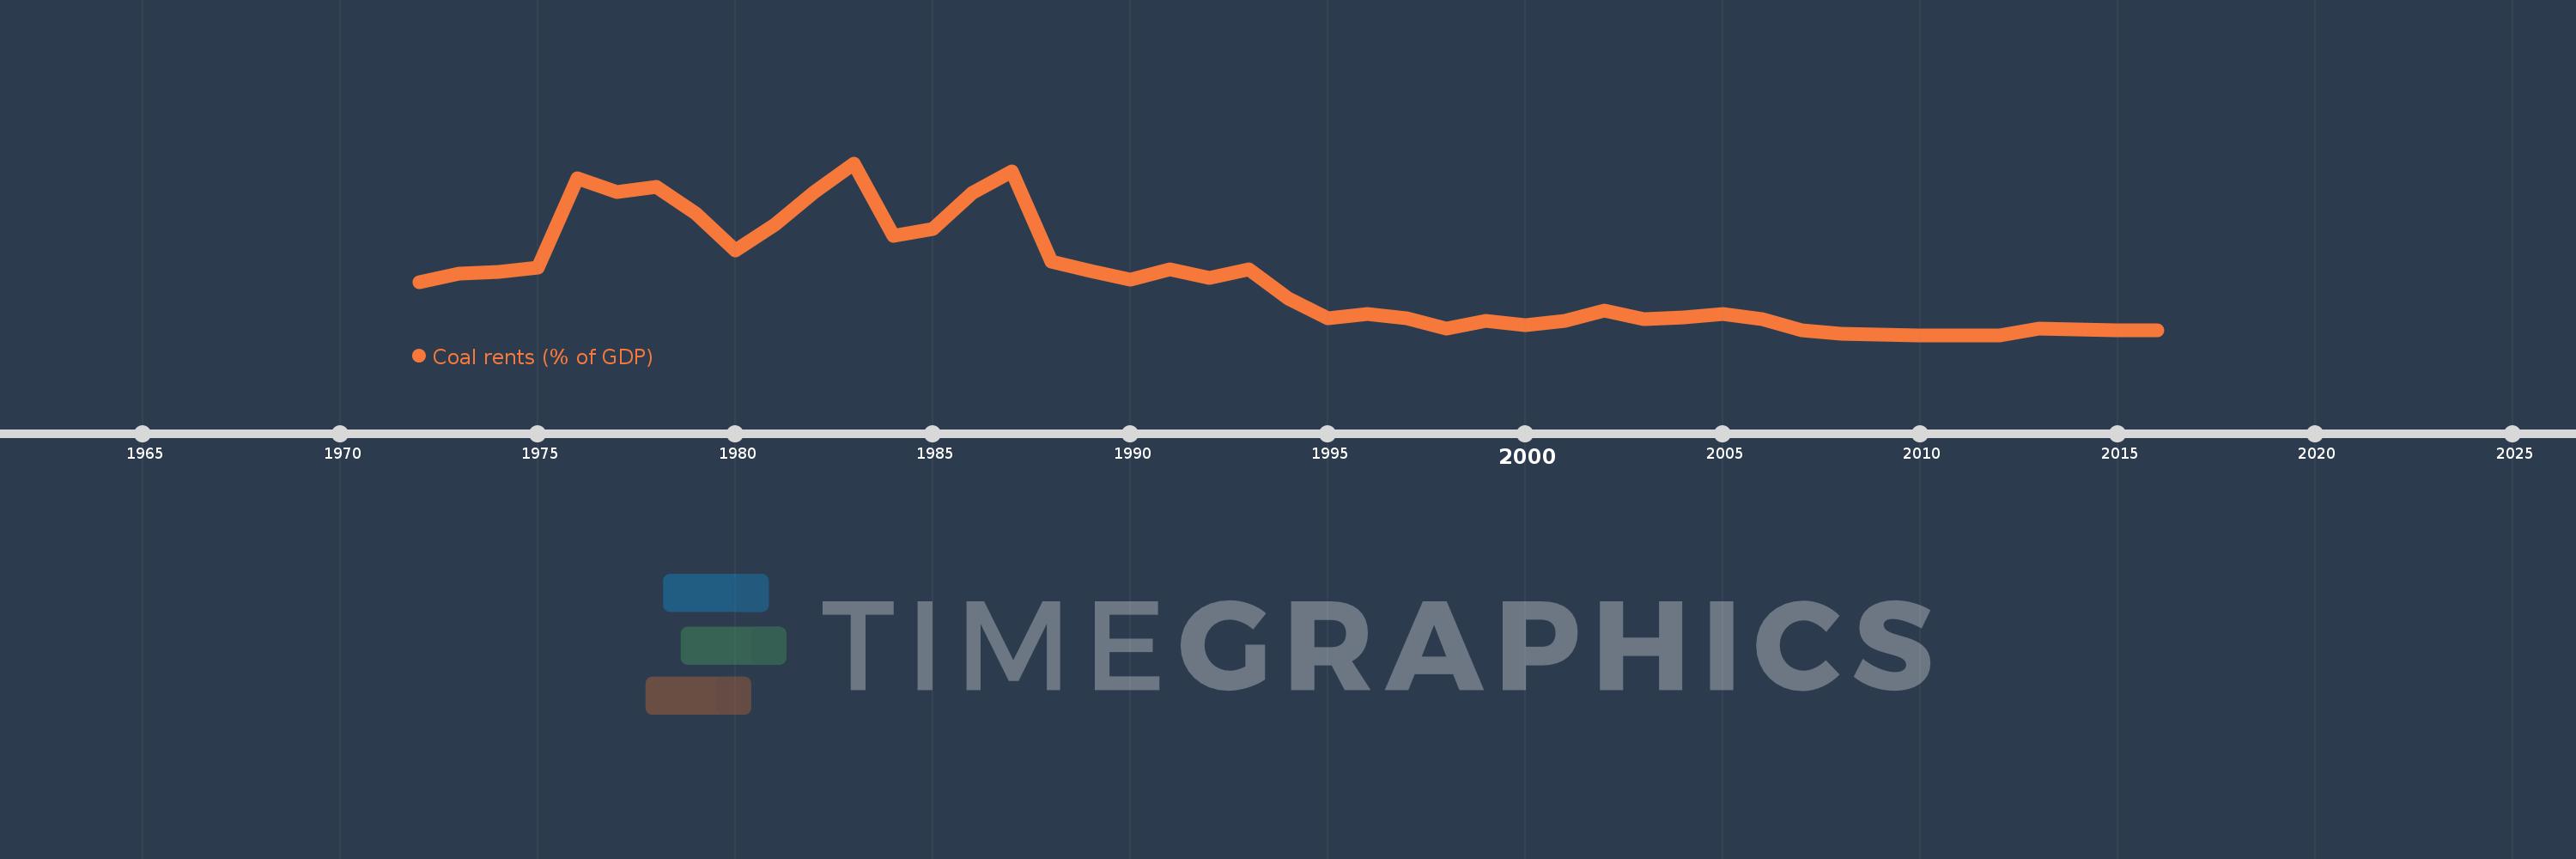
Coal rents (% of GDP)
2016,2015,2014,2013,2012,2011,2010,2009,2008,2007,2006,2005,2004,2003,2002,2001,2000,1999,1998,1997,1996,1995,1994,1993,1992,1991,1990,1989,1988,1987,1986,1985,1984,1983,1982,1981,1980,1979,1978,1977,1976,1975,1974,1973,1972
Estas estatísticas em outros países:
AfghanistanAlbaniaAlgeriaAngolaAntigua and BarbudaArab WorldArgentinaArmeniaArubaAustraliaAustriaAzerbaijanBahamas, TheBahrainBangladeshBarbadosBelarusBelgiumBelizeBeninBermudaBhutanBoliviaBosnia and HerzegovinaBotswanaBrazilBrunei DarussalamBulgariaBurkina FasoBurundiCabo VerdeCambodiaCameroonCanadaCaribbean small statesCayman IslandsCentral African RepublicCentral Europe and the BalticsChadChileChinaColombiaComorosCongo, Dem. Rep.Congo, Rep.Costa RicaCote d'IvoireCroatiaCubaCyprusCzech RepublicDenmarkDjiboutiDominicaDominican RepublicEarly-demographic dividendEast Asia & PacificEast Asia & Pacific (excluding high income)East Asia & Pacific (IDA & IBRD countries)EcuadorEgypt, Arab Rep.El SalvadorEquatorial GuineaEritreaEstoniaEthiopiaEuro areaEurope & Central AsiaEurope & Central Asia (excluding high income)Europe & Central Asia (IDA & IBRD countries)European UnionFijiFinlandFragile and conflict affected situationsFranceFrench PolynesiaGabonGambia, TheGeorgiaGermanyGhanaGreeceGreenlandGrenadaGuatemalaGuineaGuinea-BissauGuyanaHaitiHeavily indebted poor countries (HIPC)High incomeHondurasHong Kong SAR, ChinaHungaryIBRD onlyIcelandIDA & IBRD totalIDA blendIDA onlyIDA totalIndiaIndonesiaIran, Islamic Rep.IraqIrelandIsraelItalyJamaicaJapanJordanKazakhstanKenyaKiribatiKorea, Rep.KosovoKuwaitKyrgyz RepublicLao PDRLate-demographic dividendLatin America & Caribbean Latin America & Caribbean (excluding high income)Latin America & the Caribbean (IDA & IBRD countries)LatviaLeast developed countries: UN classificationLebanonLesothoLiberiaLibyaLithuaniaLow & middle incomeLow incomeLower middle incomeLuxembourgMacao SAR, ChinaMacedonia, FYRMadagascarMalawiMalaysiaMaldivesMaliMaltaMauritaniaMauritiusMexicoMiddle East & North AfricaMiddle East & North Africa (excluding high income)Middle East & North Africa (IDA & IBRD countries)Middle incomeMoldovaMongoliaMontenegroMoroccoMozambiqueMyanmarNamibiaNepalNetherlandsNew CaledoniaNew ZealandNicaraguaNigerNigeriaNorth AmericaNorwayOECD membersOmanOther small statesPacific island small statesPakistanPanamaPapua New GuineaParaguayPeruPhilippinesPolandPortugalPost-demographic dividendPre-demographic dividendPuerto RicoQatarRomaniaRussian FederationRwandaSamoaSao Tome and PrincipeSaudi ArabiaSenegalSerbiaSeychellesSierra LeoneSingaporeSlovak RepublicSloveniaSmall statesSolomon IslandsSouth AfricaSouth AsiaSouth Asia (IDA & IBRD)SpainSri LankaSt. Kitts and NevisSt. LuciaSt. Vincent and the GrenadinesSub-Saharan Africa Sub-Saharan Africa (excluding high income)Sub-Saharan Africa (IDA & IBRD countries)SudanSurinameSwazilandSwedenSwitzerlandSyrian Arab RepublicTajikistanTanzaniaThailandTimor-LesteTogoTongaTrinidad and TobagoTunisiaTurkeyTurkmenistanUgandaUkraineUnited Arab EmiratesUnited KingdomUnited StatesUpper middle incomeUruguayUzbekistanVanuatuVenezuela, RBVietnamVirgin Islands (U.S.)West Bank and GazaWorldYemen, Rep.ZambiaZimbabwe Linha do tempo:
Nesta escala de tempo está apresentado um gráfico de 1972 ano até 2016 ano Zambia. Dados de 1971 ano ausente. O número de observações reais por data: 45.
Fonte (nome):
Indicadores de desenvolvimento mundial
Fonte (organização):
Estimates based on sources and methods described in "The Changing Wealth of Nations: Measuring Sustainable Development in the New Millennium" (World Bank, 2011).
Categorias:
Environment
Foi atualizado:
23 abr 2017 ano
Indicadores de alterações dos valores ao longo dos anos
Máximo:
0.578
1 jan 1983 ano
Na data de observação
Valor
Mudança absoluta
A alteração em relação ao valor anterior
1 jan 1972 ano
0.178
+0.178
0.0%
1 jan 1973 ano
0.208
+0.03
17.02%
1 jan 1974 ano
0.212
+0.004
1.83%
1 jan 1975 ano
0.228
+0.016
7.78%
1 jan 1976 ano
0.526
+0.298
130.51%
1 jan 1977 ano
0.481
-0.045
-8.52%
1 jan 1978 ano
0.499
+0.018
3.71%
1 jan 1979 ano
0.41
-0.089
-17.89%
1 jan 1980 ano
0.286
-0.124
-30.21%
1 jan 1981 ano
0.37
+0.084
29.41%
1 jan 1982 ano
0.482
+0.112
30.37%
1 jan 1983 ano
0.578
+0.096
19.85%
1 jan 1984 ano
0.335
-0.243
-42.1%
1 jan 1985 ano
0.357
+0.022
6.57%
1 jan 1986 ano
0.477
+0.12
33.73%
1 jan 1987 ano
0.55
+0.073
15.38%
1 jan 1988 ano
0.247
-0.304
-55.15%
1 jan 1989 ano
0.216
-0.031
-12.5%
1 jan 1990 ano
0.186
-0.03
-13.84%
1 jan 1991 ano
0.221
+0.034
18.49%
1 jan 1992 ano
0.191
-0.03
-13.4%
1 jan 1993 ano
0.222
+0.031
16.18%
1 jan 1994 ano
0.124
-0.098
-44.08%
1 jan 1995 ano
0.055
-0.069
-55.44%
1 jan 1996 ano
0.071
+0.016
28.35%
1 jan 1997 ano
0.055
-0.016
-22.81%
1 jan 1998 ano
0.023
-0.032
-58.56%
1 jan 1999 ano
0.048
+0.025
109.44%
1 jan 2000 ano
0.033
-0.015
-31.01%
1 jan 2001 ano
0.048
+0.016
47.68%
1 jan 2002 ano
0.083
+0.034
70.99%
1 jan 2003 ano
0.054
-0.029
-34.71%
1 jan 2004 ano
0.059
+0.005
8.99%
1 jan 2005 ano
0.071
+0.012
20.2%
1 jan 2006 ano
0.053
-0.018
-25.54%
1 jan 2007 ano
0.016
-0.037
-70.6%
1 jan 2008 ano
0.004
-0.011
-72.53%
1 jan 2009 ano
0.001
-0.004
-87.84%
1 jan 2010 ano
0.0
0.0
-62.92%
1 jan 2011 ano
0.0
+0.0
30.63%
1 jan 2012 ano
0.0
+0.0
17.29%
1 jan 2013 ano
0.021
+0.021
7.12 mil%
1 jan 2014 ano
0.019
-0.003
-11.83%
1 jan 2015 ano
0.015
-0.003
-18.25%
1 jan 2016 ano
0.016
+0.001
4.37%
Classificação de países por estatísticas atuais por anos


Comentários: