29
/pt/
pt
AIzaSyAYiBZKx7MnpbEhh9jyipgxe19OcubqV5w
April 1, 2024
211475
Niger
NER
true
2
1
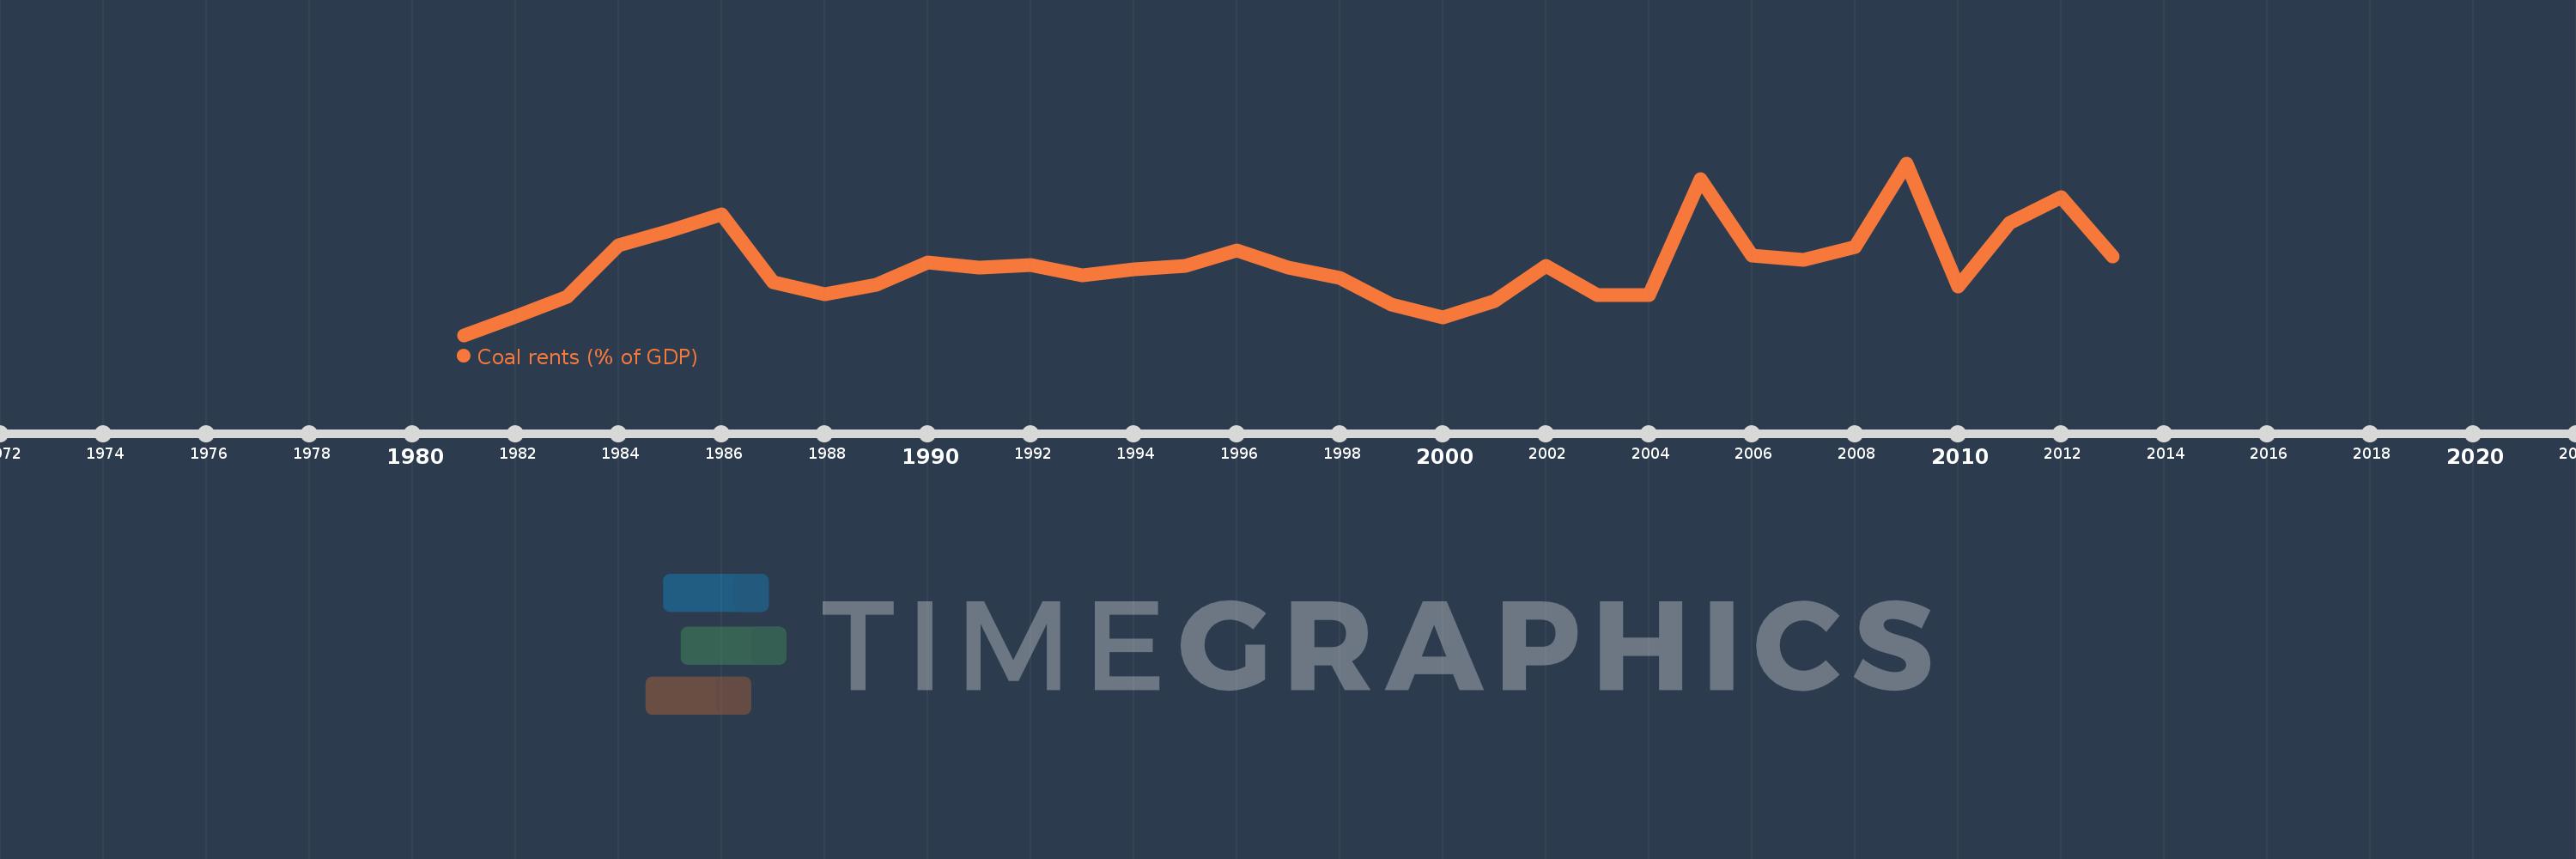
Coal rents (% of GDP)
2013,2012,2011,2010,2009,2008,2007,2006,2005,2004,2003,2002,2001,2000,1999,1998,1997,1996,1995,1994,1993,1992,1991,1990,1989,1988,1987,1986,1985,1984,1983,1982,1981
Estas estatísticas em outros países:
AfghanistanAlbaniaAlgeriaAngolaAntigua and BarbudaArab WorldArgentinaArmeniaArubaAustraliaAustriaAzerbaijanBahamas, TheBahrainBangladeshBarbadosBelarusBelgiumBelizeBeninBermudaBhutanBoliviaBosnia and HerzegovinaBotswanaBrazilBrunei DarussalamBulgariaBurkina FasoBurundiCabo VerdeCambodiaCameroonCanadaCaribbean small statesCayman IslandsCentral African RepublicCentral Europe and the BalticsChadChileChinaColombiaComorosCongo, Dem. Rep.Congo, Rep.Costa RicaCote d'IvoireCroatiaCubaCyprusCzech RepublicDenmarkDjiboutiDominicaDominican RepublicEarly-demographic dividendEast Asia & PacificEast Asia & Pacific (excluding high income)East Asia & Pacific (IDA & IBRD countries)EcuadorEgypt, Arab Rep.El SalvadorEquatorial GuineaEritreaEstoniaEthiopiaEuro areaEurope & Central AsiaEurope & Central Asia (excluding high income)Europe & Central Asia (IDA & IBRD countries)European UnionFijiFinlandFragile and conflict affected situationsFranceFrench PolynesiaGabonGambia, TheGeorgiaGermanyGhanaGreeceGreenlandGrenadaGuatemalaGuineaGuinea-BissauGuyanaHaitiHeavily indebted poor countries (HIPC)High incomeHondurasHong Kong SAR, ChinaHungaryIBRD onlyIcelandIDA & IBRD totalIDA blendIDA onlyIDA totalIndiaIndonesiaIran, Islamic Rep.IraqIrelandIsraelItalyJamaicaJapanJordanKazakhstanKenyaKiribatiKorea, Rep.KosovoKuwaitKyrgyz RepublicLao PDRLate-demographic dividendLatin America & Caribbean Latin America & Caribbean (excluding high income)Latin America & the Caribbean (IDA & IBRD countries)LatviaLeast developed countries: UN classificationLebanonLesothoLiberiaLibyaLithuaniaLow & middle incomeLow incomeLower middle incomeLuxembourgMacao SAR, ChinaMacedonia, FYRMadagascarMalawiMalaysiaMaldivesMaliMaltaMauritaniaMauritiusMexicoMiddle East & North AfricaMiddle East & North Africa (excluding high income)Middle East & North Africa (IDA & IBRD countries)Middle incomeMoldovaMongoliaMontenegroMoroccoMozambiqueMyanmarNamibiaNepalNetherlandsNew CaledoniaNew ZealandNicaraguaNigerNigeriaNorth AmericaNorwayOECD membersOmanOther small statesPacific island small statesPakistanPanamaPapua New GuineaParaguayPeruPhilippinesPolandPortugalPost-demographic dividendPre-demographic dividendPuerto RicoQatarRomaniaRussian FederationRwandaSamoaSao Tome and PrincipeSaudi ArabiaSenegalSerbiaSeychellesSierra LeoneSingaporeSlovak RepublicSloveniaSmall statesSolomon IslandsSouth AfricaSouth AsiaSouth Asia (IDA & IBRD)SpainSri LankaSt. Kitts and NevisSt. LuciaSt. Vincent and the GrenadinesSub-Saharan Africa Sub-Saharan Africa (excluding high income)Sub-Saharan Africa (IDA & IBRD countries)SudanSurinameSwazilandSwedenSwitzerlandSyrian Arab RepublicTajikistanTanzaniaThailandTimor-LesteTogoTongaTrinidad and TobagoTunisiaTurkeyTurkmenistanUgandaUkraineUnited Arab EmiratesUnited KingdomUnited StatesUpper middle incomeUruguayUzbekistanVanuatuVenezuela, RBVietnamVirgin Islands (U.S.)West Bank and GazaWorldYemen, Rep.ZambiaZimbabwe Linha do tempo:
Nesta escala de tempo está apresentado um gráfico de 1981 ano até 2013 ano Niger. Dados de 1980 ano ausente. O número de observações reais por data: 33.
Fonte (nome):
Indicadores de desenvolvimento mundial
Fonte (organização):
Estimates based on sources and methods described in "The Changing Wealth of Nations: Measuring Sustainable Development in the New Millennium" (World Bank, 2011).
Categorias:
Environment
Foi atualizado:
23 abr 2017 ano
Indicadores de alterações dos valores ao longo dos anos
Mínimo:
0.02
1 jan 1981 ano
Máximo:
0.301
1 jan 2009 ano
Na data de observação
Valor
Mudança absoluta
A alteração em relação ao valor anterior
1 jan 1981 ano
0.02
+0.02
0.0%
1 jan 1982 ano
0.05
+0.03
155.2%
1 jan 1983 ano
0.083
+0.033
66.98%
1 jan 1984 ano
0.167
+0.084
100.52%
1 jan 1985 ano
0.191
+0.024
14.24%
1 jan 1986 ano
0.218
+0.027
14.32%
1 jan 1987 ano
0.106
-0.112
-51.58%
1 jan 1988 ano
0.087
-0.019
-17.74%
1 jan 1989 ano
0.102
+0.015
17.06%
1 jan 1990 ano
0.139
+0.037
36.29%
1 jan 1991 ano
0.13
-0.009
-6.24%
1 jan 1992 ano
0.135
+0.005
3.7%
1 jan 1993 ano
0.118
-0.016
-12.1%
1 jan 1994 ano
0.127
+0.009
7.4%
1 jan 1995 ano
0.133
+0.006
4.49%
1 jan 1996 ano
0.159
+0.026
19.68%
1 jan 1997 ano
0.13
-0.029
-18.12%
1 jan 1998 ano
0.113
-0.017
-13.15%
1 jan 1999 ano
0.07
-0.043
-37.86%
1 jan 2000 ano
0.049
-0.021
-29.76%
1 jan 2001 ano
0.075
+0.026
52.6%
1 jan 2002 ano
0.133
+0.058
76.99%
1 jan 2003 ano
0.085
-0.048
-36.02%
1 jan 2004 ano
0.085
0.0
-0.19%
1 jan 2005 ano
0.275
+0.19
223.17%
1 jan 2006 ano
0.15
-0.125
-45.38%
1 jan 2007 ano
0.143
-0.007
-4.61%
1 jan 2008 ano
0.164
+0.021
14.34%
1 jan 2009 ano
0.301
+0.137
83.79%
1 jan 2010 ano
0.1
-0.201
-66.85%
1 jan 2011 ano
0.203
+0.103
103.16%
1 jan 2012 ano
0.246
+0.043
21.19%
1 jan 2013 ano
0.148
-0.098
-39.95%
Classificação de países por estatísticas atuais por anos


Comentários: