29
/pt/
pt
AIzaSyAYiBZKx7MnpbEhh9jyipgxe19OcubqV5w
April 1, 2024
280481
Vanuatu
VUT
true
2
1
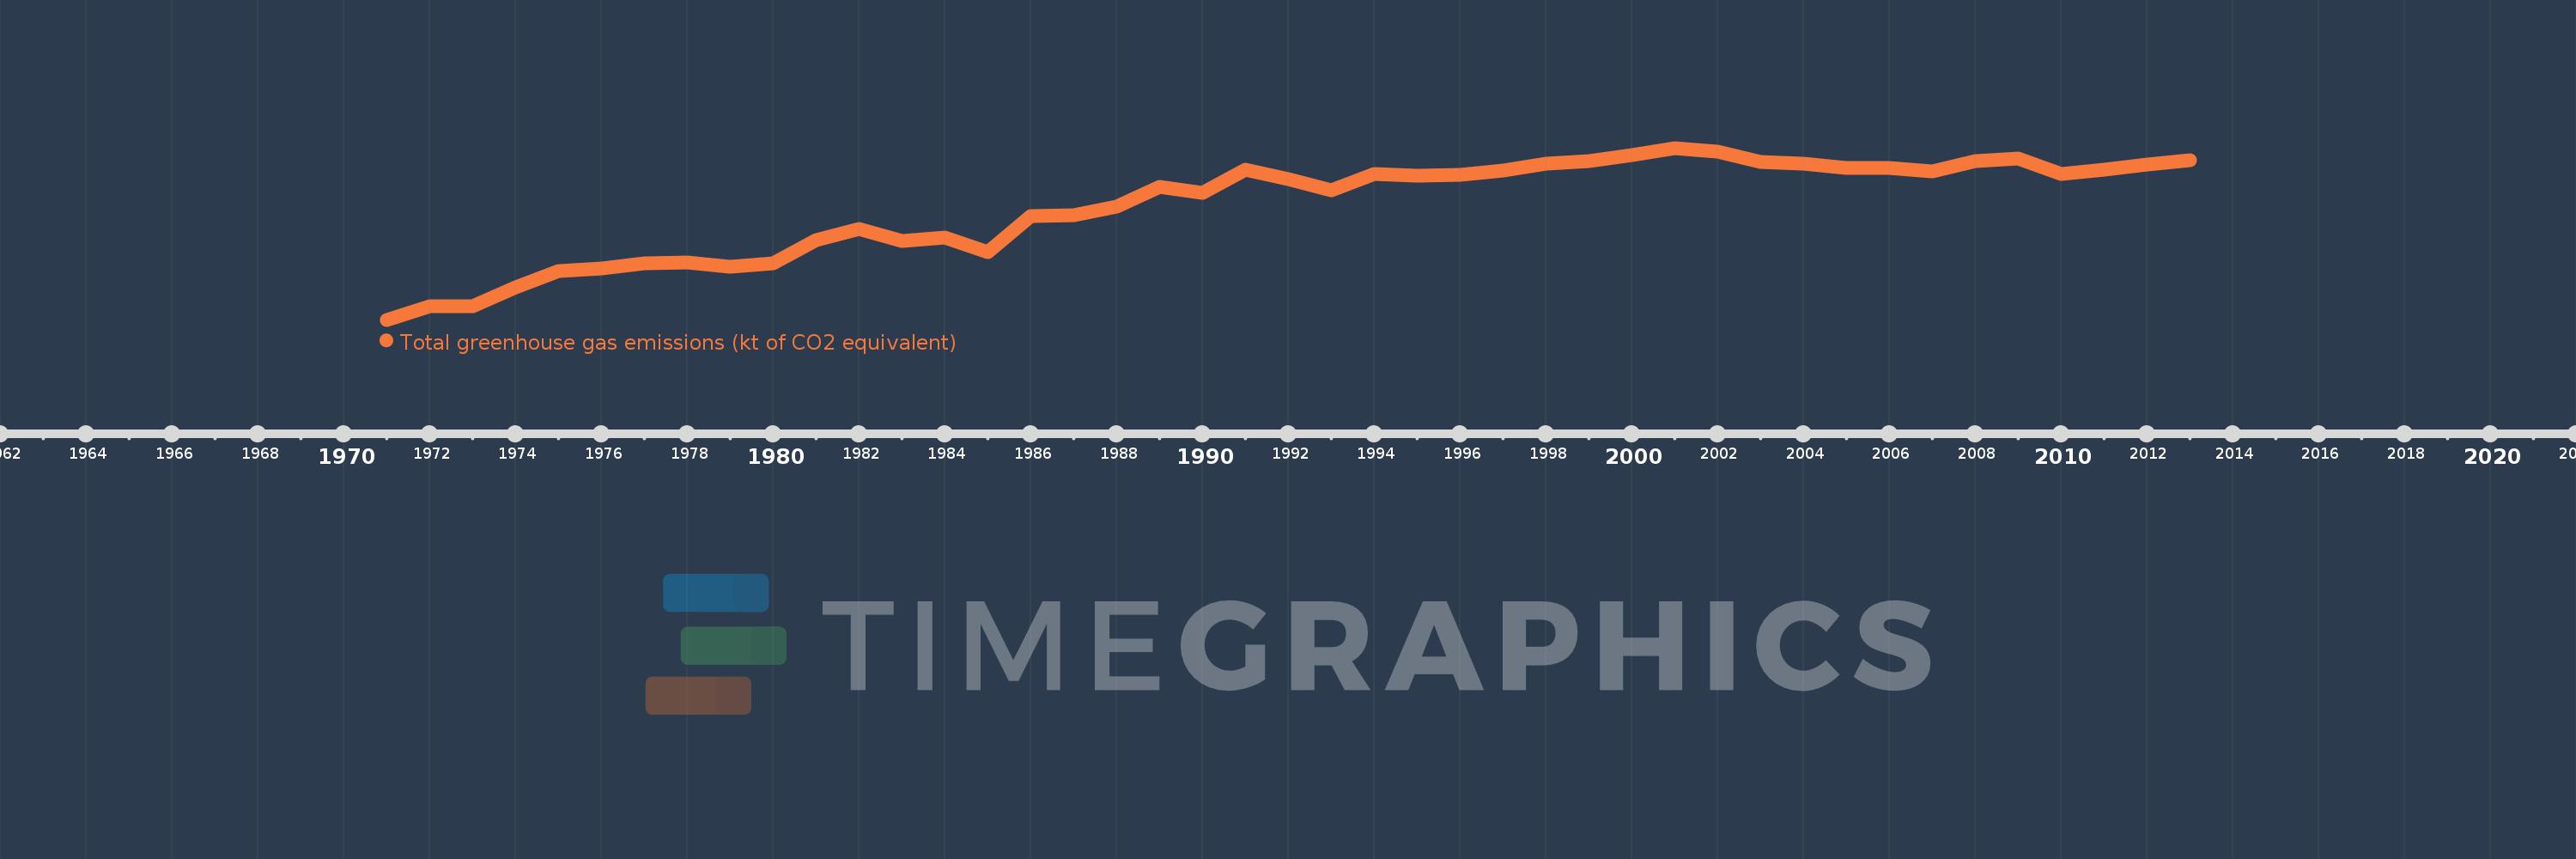
Total greenhouse gas emissions (kt of CO2 equivalent)
2013,2012,2011,2010,2009,2008,2007,2006,2005,2004,2003,2002,2001,2000,1999,1998,1997,1996,1995,1994,1993,1992,1991,1990,1989,1988,1987,1986,1985,1984,1983,1982,1981,1980,1979,1978,1977,1976,1975,1974,1973,1972,1971
Estas estatísticas em outros países:
AfghanistanAlbaniaAlgeriaAmerican SamoaAngolaAntigua and BarbudaArab WorldArgentinaArmeniaArubaAustraliaAustriaAzerbaijanBahamas, TheBahrainBangladeshBarbadosBelarusBelgiumBelizeBeninBermudaBhutanBoliviaBosnia and HerzegovinaBotswanaBrazilBritish Virgin IslandsBrunei DarussalamBulgariaBurkina FasoBurundiCabo VerdeCambodiaCameroonCanadaCaribbean small statesCayman IslandsCentral African RepublicCentral Europe and the BalticsChadChileChinaColombiaComorosCongo, Dem. Rep.Congo, Rep.Costa RicaCote d'IvoireCroatiaCubaCyprusCzech RepublicDenmarkDjiboutiDominicaDominican RepublicEarly-demographic dividendEast Asia & PacificEast Asia & Pacific (excluding high income)East Asia & Pacific (IDA & IBRD countries)EcuadorEgypt, Arab Rep.El SalvadorEquatorial GuineaEritreaEstoniaEthiopiaEuro areaEurope & Central AsiaEurope & Central Asia (excluding high income)Europe & Central Asia (IDA & IBRD countries)European UnionFijiFinlandFragile and conflict affected situationsFranceFrench PolynesiaGabonGambia, TheGeorgiaGermanyGhanaGibraltarGreeceGrenadaGuamGuatemalaGuineaGuinea-BissauGuyanaHaitiHeavily indebted poor countries (HIPC)High incomeHondurasHong Kong SAR, ChinaHungaryIBRD onlyIcelandIDA & IBRD totalIDA blendIDA onlyIDA totalIndiaIndonesiaIran, Islamic Rep.IraqIrelandIsraelItalyJamaicaJapanJordanKazakhstanKenyaKiribatiKorea, Dem. People’s Rep.Korea, Rep.KuwaitKyrgyz RepublicLao PDRLate-demographic dividendLatin America & Caribbean Latin America & Caribbean (excluding high income)Latin America & the Caribbean (IDA & IBRD countries)LatviaLeast developed countries: UN classificationLebanonLesothoLiberiaLibyaLithuaniaLow & middle incomeLow incomeLower middle incomeLuxembourgMacao SAR, ChinaMacedonia, FYRMadagascarMalawiMalaysiaMaldivesMaliMaltaMarshall IslandsMauritaniaMauritiusMexicoMicronesia, Fed. Sts.Middle East & North AfricaMiddle East & North Africa (excluding high income)Middle East & North Africa (IDA & IBRD countries)Middle incomeMoldovaMongoliaMoroccoMozambiqueMyanmarNamibiaNepalNetherlandsNew CaledoniaNew ZealandNicaraguaNigerNigeriaNorth AmericaNorthern Mariana IslandsNorwayOECD membersOmanOther small statesPacific island small statesPakistanPanamaPapua New GuineaParaguayPeruPhilippinesPolandPortugalPost-demographic dividendPre-demographic dividendPuerto RicoQatarRomaniaRussian FederationRwandaSamoaSao Tome and PrincipeSaudi ArabiaSenegalSeychellesSierra LeoneSingaporeSlovak RepublicSloveniaSmall statesSolomon IslandsSomaliaSouth AfricaSouth AsiaSouth Asia (IDA & IBRD)SpainSri LankaSt. Kitts and NevisSt. LuciaSt. Vincent and the GrenadinesSub-Saharan Africa Sub-Saharan Africa (excluding high income)Sub-Saharan Africa (IDA & IBRD countries)SudanSurinameSwazilandSwedenSwitzerlandSyrian Arab RepublicTajikistanTanzaniaThailandTimor-LesteTogoTongaTrinidad and TobagoTunisiaTurkeyTurkmenistanTurks and Caicos IslandsTuvaluUgandaUkraineUnited Arab EmiratesUnited KingdomUnited StatesUpper middle incomeUruguayUzbekistanVanuatuVenezuela, RBVietnamVirgin Islands (U.S.)WorldYemen, Rep.ZambiaZimbabwe Linha do tempo:
Nesta escala de tempo está apresentado um gráfico de 1971 ano até 2013 ano Vanuatu. Dados de 1970 ano ausente. O número de observações reais por data: 43.
Fonte (nome):
Indicadores de desenvolvimento mundial
Fonte (organização):
European Commission, Joint Research Centre (JRC)/Netherlands Environmental Assessment Agency (PBL). Emission Database for Global Atmospheric Research (EDGAR), EDGARv4.2 FT2012: http://edgar.jrc.ec.europa.eu/
Categorias:
Climate Change, Environment
Foi atualizado:
23 abr 2017 ano
Indicadores de alterações dos valores ao longo dos anos
Mínimo:
230.167
1 jan 1971 ano
Máximo:
462.64
1 jan 2001 ano
Na data de observação
Valor
Mudança absoluta
A alteração em relação ao valor anterior
1 jan 1971 ano
230.167
+230.167
0.0%
1 jan 1972 ano
248.107
+17.94
7.79%
1 jan 1973 ano
248.292
+0.185
0.07%
1 jan 1974 ano
273.714
+25.421
10.24%
1 jan 1975 ano
295.981
+22.267
8.14%
1 jan 1976 ano
299.02
+3.039
1.03%
1 jan 1977 ano
307.014
+7.994
2.67%
1 jan 1978 ano
307.471
+0.457
0.15%
1 jan 1979 ano
302.254
-5.217
-1.7%
1 jan 1980 ano
306.431
+4.177
1.38%
1 jan 1981 ano
337.826
+31.395
10.25%
1 jan 1982 ano
352.833
+15.007
4.44%
1 jan 1983 ano
336.964
-15.869
-4.5%
1 jan 1984 ano
341.638
+4.673
1.39%
1 jan 1985 ano
321.586
-20.052
-5.87%
1 jan 1986 ano
370.003
+48.417
15.06%
1 jan 1987 ano
371.798
+1.795
0.49%
1 jan 1988 ano
382.758
+10.96
2.95%
1 jan 1989 ano
409.833
+27.075
7.07%
1 jan 1990 ano
401.336
-8.497
-2.07%
1 jan 1991 ano
433.352
+32.016
7.98%
1 jan 1992 ano
420.535
-12.817
-2.96%
1 jan 1993 ano
404.759
-15.776
-3.75%
1 jan 1994 ano
427.679
+22.92
5.66%
1 jan 1995 ano
425.155
-2.524
-0.59%
1 jan 1996 ano
426.352
+1.197
0.28%
1 jan 1997 ano
431.838
+5.486
1.29%
1 jan 1998 ano
441.632
+9.794
2.27%
1 jan 1999 ano
444.367
+2.735
0.62%
1 jan 2000 ano
453.23
+8.864
1.99%
1 jan 2001 ano
462.64
+9.41
2.08%
1 jan 2002 ano
457.103
-5.537
-1.2%
1 jan 2003 ano
443.534
-13.569
-2.97%
1 jan 2004 ano
441.342
-2.192
-0.49%
1 jan 2005 ano
435.051
-6.291
-1.43%
1 jan 2006 ano
436.137
+1.087
0.25%
1 jan 2007 ano
431.279
-4.858
-1.11%
1 jan 2008 ano
444.505
+13.226
3.07%
1 jan 2009 ano
448.643
+4.138
0.93%
1 jan 2010 ano
426.859
-21.784
-4.86%
1 jan 2011 ano
433.766
+6.907
1.62%
1 jan 2012 ano
440.153
+6.387
1.47%
1 jan 2013 ano
446.221
+6.068
1.38%
Classificação de países por estatísticas atuais por anos


Comentários: