29
/pt/
pt
AIzaSyAYiBZKx7MnpbEhh9jyipgxe19OcubqV5w
April 1, 2024
264078
Timor-Leste
TLS
true
2
1
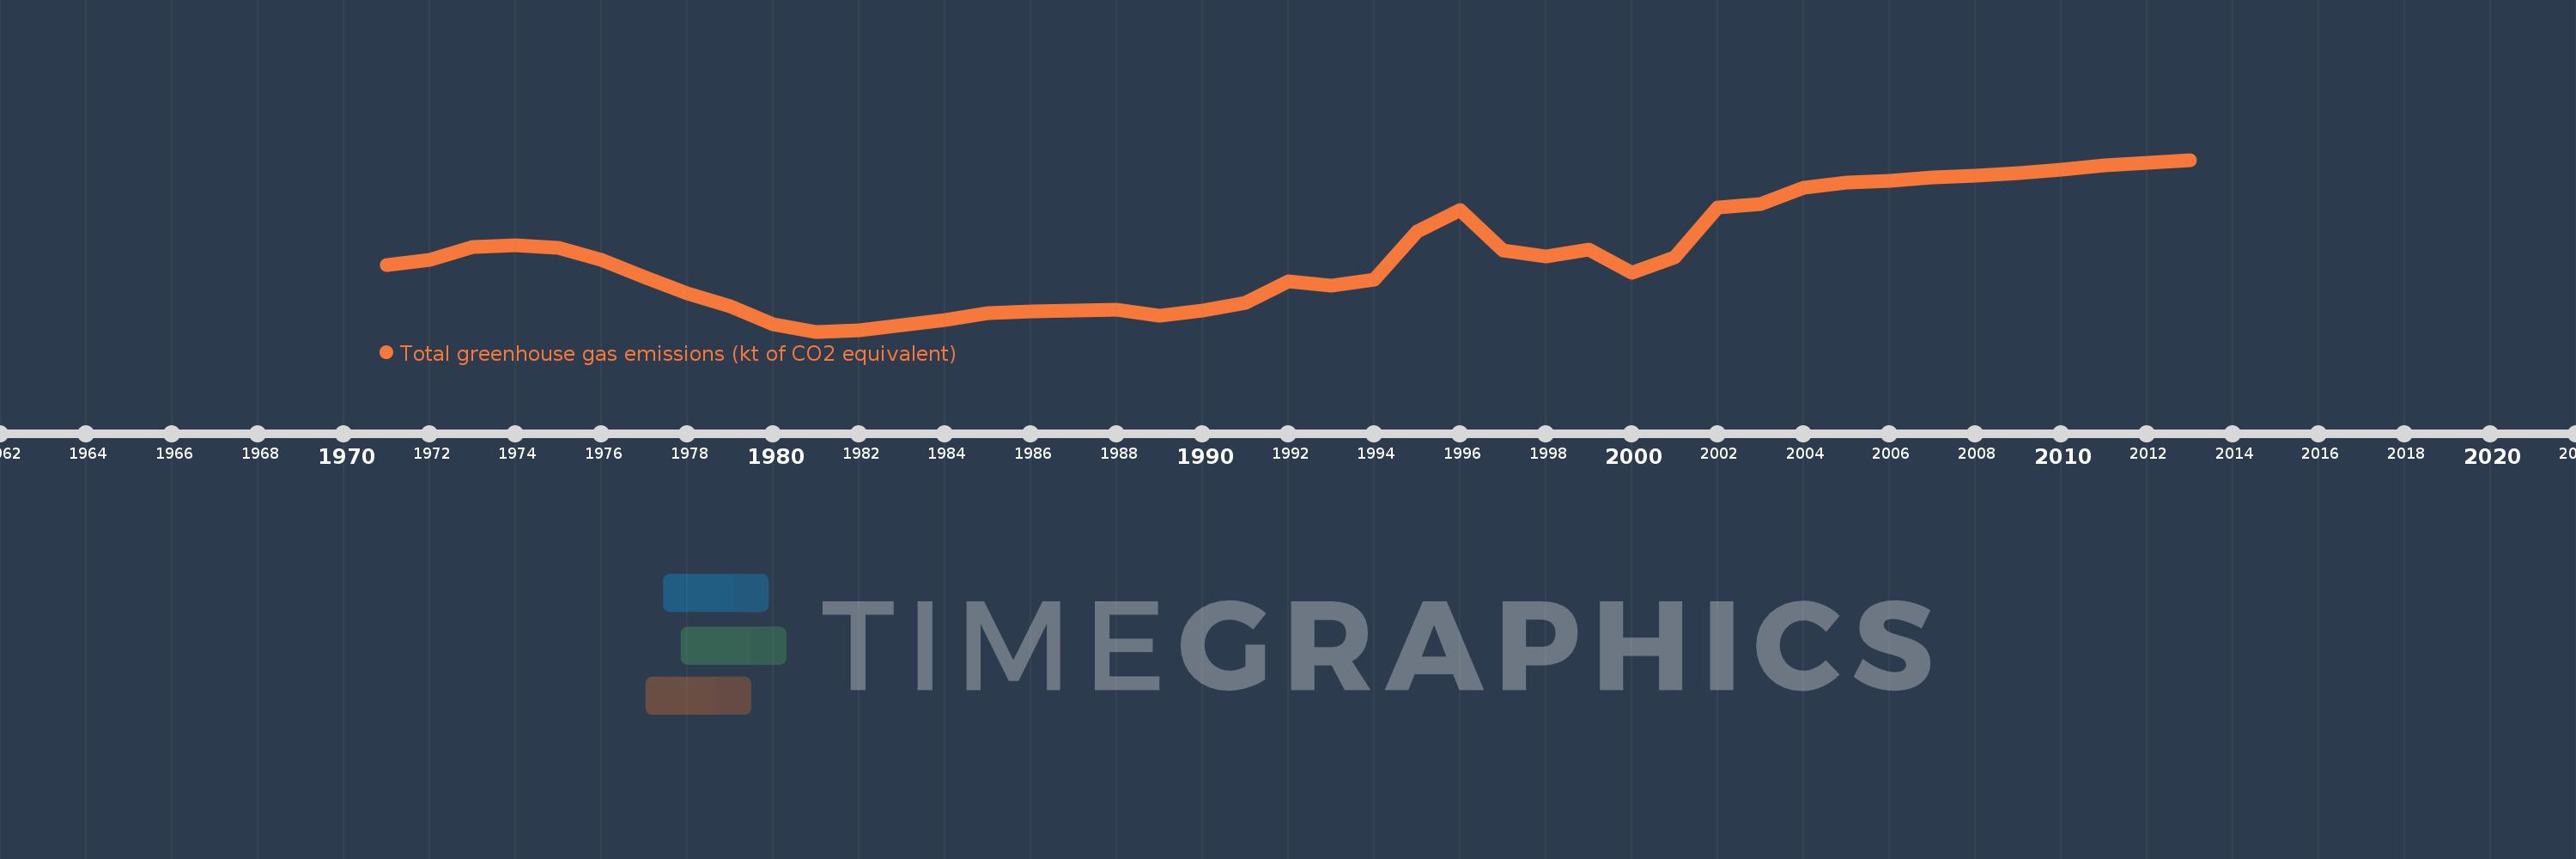
Total greenhouse gas emissions (kt of CO2 equivalent)
2013,2012,2011,2010,2009,2008,2007,2006,2005,2004,2003,2002,2001,2000,1999,1998,1997,1996,1995,1994,1993,1992,1991,1990,1989,1988,1987,1986,1985,1984,1983,1982,1981,1980,1979,1978,1977,1976,1975,1974,1973,1972,1971
Estas estatísticas em outros países:
AfghanistanAlbaniaAlgeriaAmerican SamoaAngolaAntigua and BarbudaArab WorldArgentinaArmeniaArubaAustraliaAustriaAzerbaijanBahamas, TheBahrainBangladeshBarbadosBelarusBelgiumBelizeBeninBermudaBhutanBoliviaBosnia and HerzegovinaBotswanaBrazilBritish Virgin IslandsBrunei DarussalamBulgariaBurkina FasoBurundiCabo VerdeCambodiaCameroonCanadaCaribbean small statesCayman IslandsCentral African RepublicCentral Europe and the BalticsChadChileChinaColombiaComorosCongo, Dem. Rep.Congo, Rep.Costa RicaCote d'IvoireCroatiaCubaCyprusCzech RepublicDenmarkDjiboutiDominicaDominican RepublicEarly-demographic dividendEast Asia & PacificEast Asia & Pacific (excluding high income)East Asia & Pacific (IDA & IBRD countries)EcuadorEgypt, Arab Rep.El SalvadorEquatorial GuineaEritreaEstoniaEthiopiaEuro areaEurope & Central AsiaEurope & Central Asia (excluding high income)Europe & Central Asia (IDA & IBRD countries)European UnionFijiFinlandFragile and conflict affected situationsFranceFrench PolynesiaGabonGambia, TheGeorgiaGermanyGhanaGibraltarGreeceGrenadaGuamGuatemalaGuineaGuinea-BissauGuyanaHaitiHeavily indebted poor countries (HIPC)High incomeHondurasHong Kong SAR, ChinaHungaryIBRD onlyIcelandIDA & IBRD totalIDA blendIDA onlyIDA totalIndiaIndonesiaIran, Islamic Rep.IraqIrelandIsraelItalyJamaicaJapanJordanKazakhstanKenyaKiribatiKorea, Dem. People’s Rep.Korea, Rep.KuwaitKyrgyz RepublicLao PDRLate-demographic dividendLatin America & Caribbean Latin America & Caribbean (excluding high income)Latin America & the Caribbean (IDA & IBRD countries)LatviaLeast developed countries: UN classificationLebanonLesothoLiberiaLibyaLithuaniaLow & middle incomeLow incomeLower middle incomeLuxembourgMacao SAR, ChinaMacedonia, FYRMadagascarMalawiMalaysiaMaldivesMaliMaltaMarshall IslandsMauritaniaMauritiusMexicoMicronesia, Fed. Sts.Middle East & North AfricaMiddle East & North Africa (excluding high income)Middle East & North Africa (IDA & IBRD countries)Middle incomeMoldovaMongoliaMoroccoMozambiqueMyanmarNamibiaNepalNetherlandsNew CaledoniaNew ZealandNicaraguaNigerNigeriaNorth AmericaNorthern Mariana IslandsNorwayOECD membersOmanOther small statesPacific island small statesPakistanPanamaPapua New GuineaParaguayPeruPhilippinesPolandPortugalPost-demographic dividendPre-demographic dividendPuerto RicoQatarRomaniaRussian FederationRwandaSamoaSao Tome and PrincipeSaudi ArabiaSenegalSeychellesSierra LeoneSingaporeSlovak RepublicSloveniaSmall statesSolomon IslandsSomaliaSouth AfricaSouth AsiaSouth Asia (IDA & IBRD)SpainSri LankaSt. Kitts and NevisSt. LuciaSt. Vincent and the GrenadinesSub-Saharan Africa Sub-Saharan Africa (excluding high income)Sub-Saharan Africa (IDA & IBRD countries)SudanSurinameSwazilandSwedenSwitzerlandSyrian Arab RepublicTajikistanTanzaniaThailandTimor-LesteTogoTongaTrinidad and TobagoTunisiaTurkeyTurkmenistanTurks and Caicos IslandsTuvaluUgandaUkraineUnited Arab EmiratesUnited KingdomUnited StatesUpper middle incomeUruguayUzbekistanVanuatuVenezuela, RBVietnamVirgin Islands (U.S.)WorldYemen, Rep.ZambiaZimbabwe Linha do tempo:
Nesta escala de tempo está apresentado um gráfico de 1971 ano até 2013 ano Timor-Leste. Dados de 1970 ano ausente. O número de observações reais por data: 43.
Fonte (nome):
Indicadores de desenvolvimento mundial
Fonte (organização):
European Commission, Joint Research Centre (JRC)/Netherlands Environmental Assessment Agency (PBL). Emission Database for Global Atmospheric Research (EDGAR), EDGARv4.2 FT2012: http://edgar.jrc.ec.europa.eu/
Categorias:
Climate Change, Environment
Foi atualizado:
23 abr 2017 ano
Indicadores de alterações dos valores ao longo dos anos
Mínimo:
351.689
1 jan 1981 ano
Máximo:
959.347
1 jan 2013 ano
Na data de observação
Valor
Mudança absoluta
A alteração em relação ao valor anterior
1 jan 1971 ano
587.753
+587.753
0.0%
1 jan 1972 ano
604.464
+16.711
2.84%
1 jan 1973 ano
651.186
+46.722
7.73%
1 jan 1974 ano
658.315
+7.129
1.09%
1 jan 1975 ano
646.902
-11.413
-1.73%
1 jan 1976 ano
604.487
-42.415
-6.56%
1 jan 1977 ano
545.594
-58.894
-9.74%
1 jan 1978 ano
485.62
-59.973
-10.99%
1 jan 1979 ano
442.093
-43.527
-8.96%
1 jan 1980 ano
377.159
-64.935
-14.69%
1 jan 1981 ano
351.689
-25.47
-6.75%
1 jan 1982 ano
356.719
+5.03
1.43%
1 jan 1983 ano
373.219
+16.5
4.63%
1 jan 1984 ano
394.161
+20.941
5.61%
1 jan 1985 ano
418.371
+24.21
6.14%
1 jan 1986 ano
423.189
+4.818
1.15%
1 jan 1987 ano
427.598
+4.409
1.04%
1 jan 1988 ano
427.787
+0.189
0.04%
1 jan 1989 ano
408.07
-19.717
-4.61%
1 jan 1990 ano
424.894
+16.824
4.12%
1 jan 1991 ano
453.017
+28.123
6.62%
1 jan 1992 ano
529.42
+76.403
16.87%
1 jan 1993 ano
512.894
-16.526
-3.12%
1 jan 1994 ano
534.993
+22.1
4.31%
1 jan 1995 ano
704.345
+169.352
31.65%
1 jan 1996 ano
781.224
+76.879
10.91%
1 jan 1997 ano
637.44
-143.784
-18.4%
1 jan 1998 ano
617.295
-20.145
-3.16%
1 jan 1999 ano
643.151
+25.856
4.19%
1 jan 2000 ano
560.325
-82.826
-12.88%
1 jan 2001 ano
615.325
+55.0
9.82%
1 jan 2002 ano
790.91
+175.584
28.54%
1 jan 2003 ano
804.051
+13.141
1.66%
1 jan 2004 ano
860.405
+56.355
7.01%
1 jan 2005 ano
878.931
+18.526
2.15%
1 jan 2006 ano
885.582
+6.651
0.76%
1 jan 2007 ano
898.096
+12.514
1.41%
1 jan 2008 ano
901.881
+3.785
0.42%
1 jan 2009 ano
912.732
+10.851
1.2%
1 jan 2010 ano
925.415
+12.684
1.39%
1 jan 2011 ano
940.46
+15.044
1.63%
1 jan 2012 ano
949.907
+9.447
1.0%
1 jan 2013 ano
959.347
+9.441
0.99%
Classificação de países por estatísticas atuais por anos


Comentários: