29
/pt/
pt
AIzaSyAYiBZKx7MnpbEhh9jyipgxe19OcubqV5w
April 1, 2024
277220
United States
USA
true
2
1
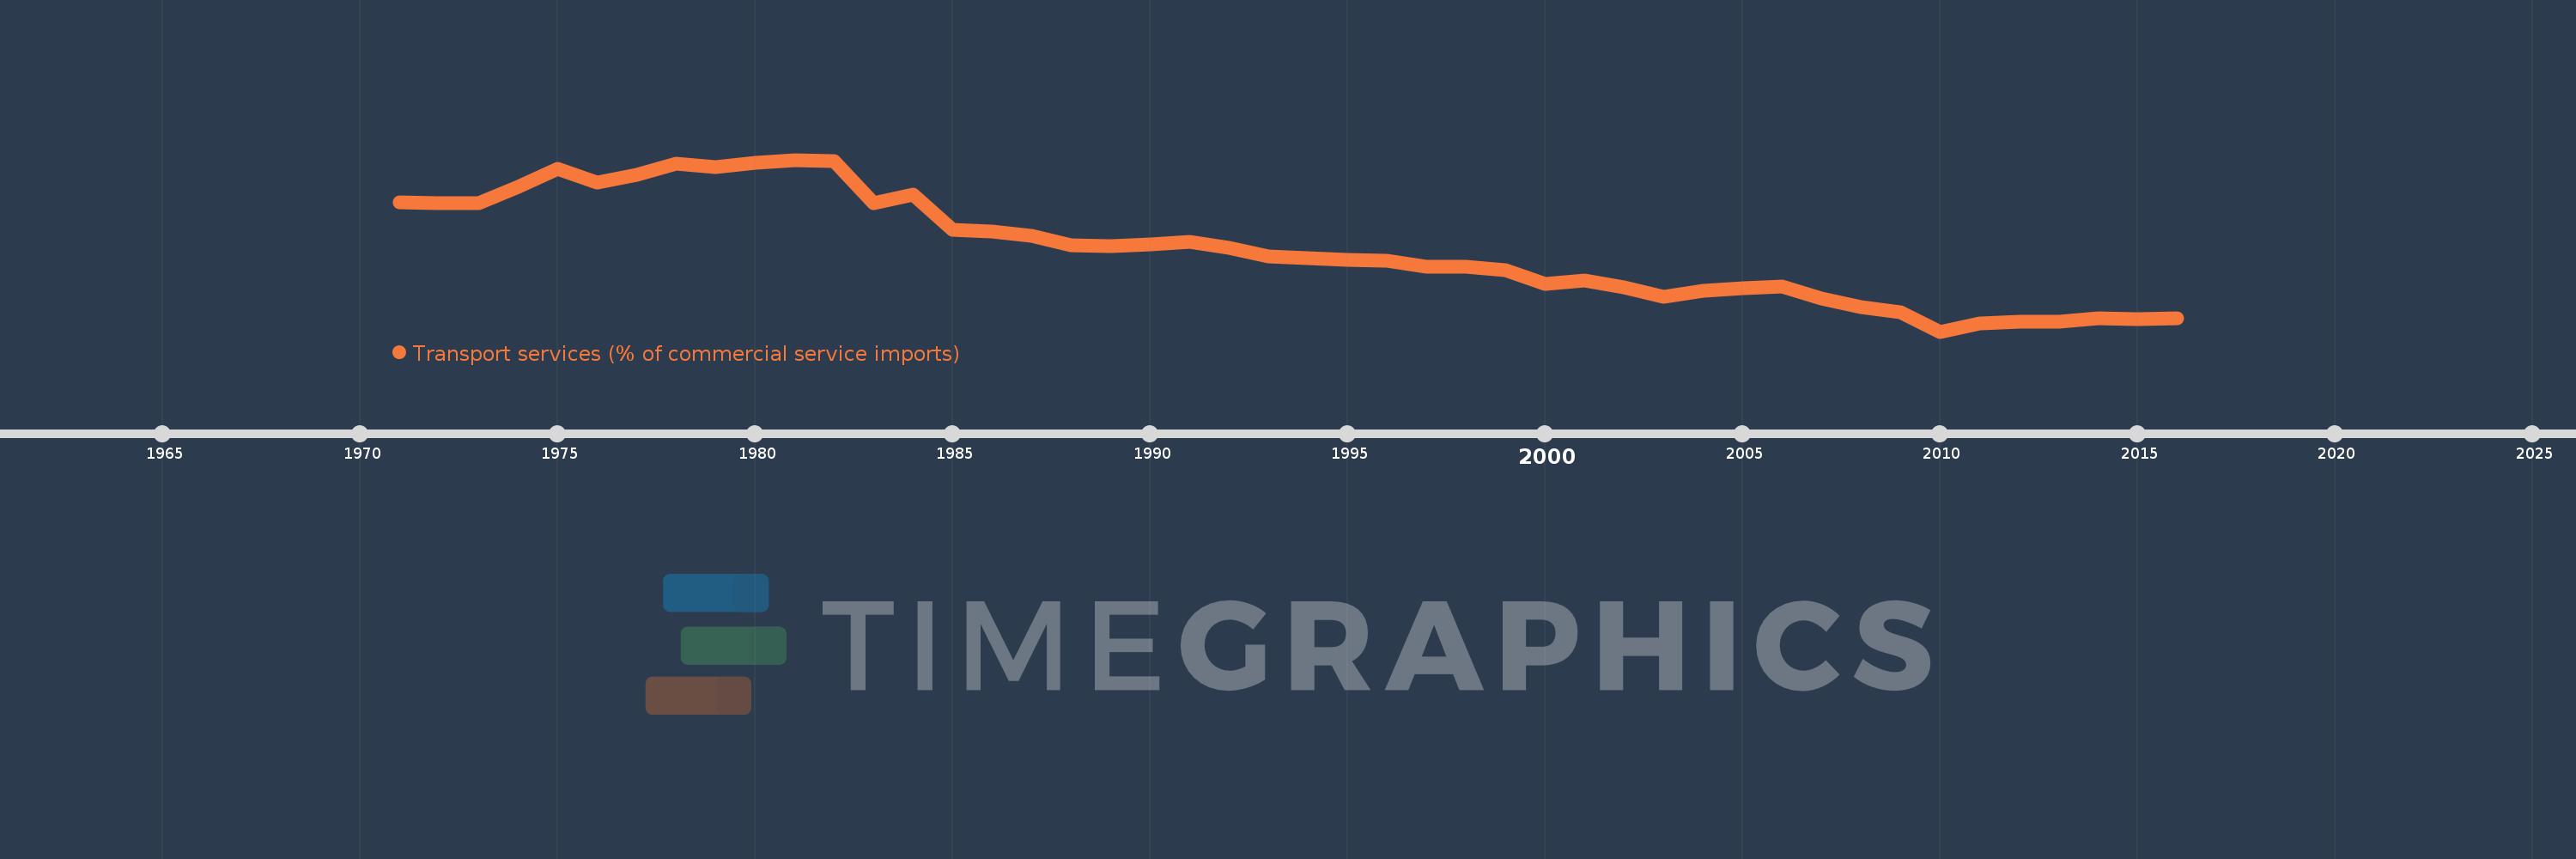
Transport services (% of commercial service imports)
2016,2015,2014,2013,2012,2011,2010,2009,2008,2007,2006,2005,2004,2003,2002,2001,2000,1999,1998,1997,1996,1995,1994,1993,1992,1991,1990,1989,1988,1987,1986,1985,1984,1983,1982,1981,1980,1979,1978,1977,1976,1975,1974,1973,1972,1971
Estas estatísticas em outros países:
AfghanistanAlbaniaAlgeriaAngolaAntigua and BarbudaArab WorldArgentinaArmeniaArubaAustraliaAustriaAzerbaijanBahamas, TheBahrainBangladeshBarbadosBelarusBelgiumBelizeBeninBermudaBhutanBoliviaBosnia and HerzegovinaBotswanaBrazilBrunei DarussalamBulgariaBurkina FasoBurundiCabo VerdeCambodiaCameroonCanadaCaribbean small statesCentral African RepublicCentral Europe and the BalticsChadChileChinaColombiaComorosCongo, Dem. Rep.Congo, Rep.Costa RicaCote d'IvoireCroatiaCuracaoCyprusCzech RepublicDenmarkDjiboutiDominicaDominican RepublicEarly-demographic dividendEast Asia & PacificEast Asia & Pacific (excluding high income)East Asia & Pacific (IDA & IBRD countries)EcuadorEgypt, Arab Rep.El SalvadorEquatorial GuineaEritreaEstoniaEthiopiaEuro areaEurope & Central AsiaEurope & Central Asia (excluding high income)Europe & Central Asia (IDA & IBRD countries)European UnionFaroe IslandsFijiFinlandFragile and conflict affected situationsFranceFrench PolynesiaGabonGambia, TheGeorgiaGermanyGhanaGreeceGrenadaGuatemalaGuineaGuinea-BissauGuyanaHaitiHeavily indebted poor countries (HIPC)High incomeHondurasHong Kong SAR, ChinaHungaryIBRD onlyIcelandIDA & IBRD totalIDA onlyIDA totalIndiaIndonesiaIran, Islamic Rep.IraqIrelandIsraelItalyJamaicaJapanJordanKazakhstanKenyaKiribatiKorea, Rep.KosovoKuwaitKyrgyz RepublicLao PDRLate-demographic dividendLatin America & Caribbean Latin America & Caribbean (excluding high income)Latin America & the Caribbean (IDA & IBRD countries)LatviaLeast developed countries: UN classificationLebanonLesothoLiberiaLibyaLithuaniaLow & middle incomeLow incomeLower middle incomeLuxembourgMacao SAR, ChinaMacedonia, FYRMadagascarMalawiMalaysiaMaldivesMaliMaltaMarshall IslandsMauritaniaMauritiusMexicoMicronesia, Fed. Sts.Middle East & North AfricaMiddle East & North Africa (excluding high income)Middle East & North Africa (IDA & IBRD countries)Middle incomeMoldovaMongoliaMontenegroMoroccoMozambiqueMyanmarNamibiaNepalNetherlandsNew CaledoniaNew ZealandNicaraguaNigerNigeriaNorth AmericaNorwayOECD membersOmanOther small statesPacific island small statesPakistanPalauPanamaPapua New GuineaParaguayPeruPhilippinesPolandPortugalPost-demographic dividendPre-demographic dividendQatarRomaniaRussian FederationRwandaSamoaSao Tome and PrincipeSaudi ArabiaSenegalSerbiaSeychellesSierra LeoneSingaporeSint Maarten (Dutch part)Slovak RepublicSloveniaSmall statesSolomon IslandsSouth AfricaSouth AsiaSouth Asia (IDA & IBRD)South SudanSpainSri LankaSt. Kitts and NevisSt. LuciaSt. Vincent and the GrenadinesSub-Saharan Africa Sub-Saharan Africa (excluding high income)Sub-Saharan Africa (IDA & IBRD countries)SudanSurinameSwazilandSwedenSwitzerlandSyrian Arab RepublicTajikistanTanzaniaThailandTimor-LesteTogoTongaTrinidad and TobagoTunisiaTurkeyTuvaluUgandaUkraineUnited KingdomUnited StatesUpper middle incomeUruguayVanuatuVenezuela, RBWest Bank and GazaWorldYemen, Rep.ZambiaZimbabwe Linha do tempo:
Nesta escala de tempo está apresentado um gráfico de 1971 ano até 2016 ano United States. Dados de 1970 ano ausente. O número de observações reais por data: 46.
Fonte (nome):
Indicadores de desenvolvimento mundial
Fonte (organização):
International Monetary Fund, Balance of Payments Statistics Yearbook and data files.
Categorias:
Private Sector, Trade
Foi atualizado:
23 abr 2017 ano
Indicadores de alterações dos valores ao longo dos anos
Mínimo:
18.048
1 jan 2010 ano
Máximo:
53.236
1 jan 1981 ano
Na data de observação
Valor
Mudança absoluta
A alteração em relação ao valor anterior
1 jan 1971 ano
44.481
+44.481
0.0%
1 jan 1972 ano
44.3
-0.181
-0.41%
1 jan 1973 ano
44.425
+0.125
0.28%
1 jan 1974 ano
47.759
+3.334
7.5%
1 jan 1975 ano
51.438
+3.679
7.7%
1 jan 1976 ano
48.538
-2.899
-5.64%
1 jan 1977 ano
50.16
+1.621
3.34%
1 jan 1978 ano
52.421
+2.261
4.51%
1 jan 1979 ano
51.656
-0.765
-1.46%
1 jan 1980 ano
52.699
+1.043
2.02%
1 jan 1981 ano
53.236
+0.538
1.02%
1 jan 1982 ano
52.998
-0.238
-0.45%
1 jan 1983 ano
44.412
-8.587
-16.2%
1 jan 1984 ano
46.072
+1.661
3.74%
1 jan 1985 ano
38.888
-7.184
-15.59%
1 jan 1986 ano
38.632
-0.255
-0.66%
1 jan 1987 ano
37.712
-0.92
-2.38%
1 jan 1988 ano
35.808
-1.904
-5.05%
1 jan 1989 ano
35.56
-0.248
-0.69%
1 jan 1990 ano
35.872
+0.312
0.88%
1 jan 1991 ano
36.38
+0.508
1.42%
1 jan 1992 ano
35.286
-1.094
-3.01%
1 jan 1993 ano
33.466
-1.82
-5.16%
1 jan 1994 ano
33.052
-0.414
-1.24%
1 jan 1995 ano
32.764
-0.287
-0.87%
1 jan 1996 ano
32.65
-0.114
-0.35%
1 jan 1997 ano
31.38
-1.27
-3.89%
1 jan 1998 ano
31.327
-0.053
-0.17%
1 jan 1999 ano
30.604
-0.723
-2.31%
1 jan 2000 ano
27.772
-2.832
-9.25%
1 jan 2001 ano
28.575
+0.803
2.89%
1 jan 2002 ano
27.173
-1.402
-4.91%
1 jan 2003 ano
25.115
-2.058
-7.57%
1 jan 2004 ano
26.47
+1.355
5.39%
1 jan 2005 ano
26.932
+0.462
1.74%
1 jan 2006 ano
27.309
+0.377
1.4%
1 jan 2007 ano
24.843
-2.466
-9.03%
1 jan 2008 ano
23.039
-1.804
-7.26%
1 jan 2009 ano
22.092
-0.948
-4.11%
1 jan 2010 ano
18.048
-4.043
-18.3%
1 jan 2011 ano
19.777
+1.729
9.58%
1 jan 2012 ano
20.119
+0.343
1.73%
1 jan 2013 ano
20.036
-0.083
-0.41%
1 jan 2014 ano
20.8
+0.763
3.81%
1 jan 2015 ano
20.603
-0.197
-0.95%
1 jan 2016 ano
20.775
+0.173
0.84%
Classificação de países por estatísticas atuais por anos


Comentários: