29
/pt/
pt
AIzaSyAYiBZKx7MnpbEhh9jyipgxe19OcubqV5w
April 1, 2024
125649
Egypt, Arab Rep.
EGY
true
2
1
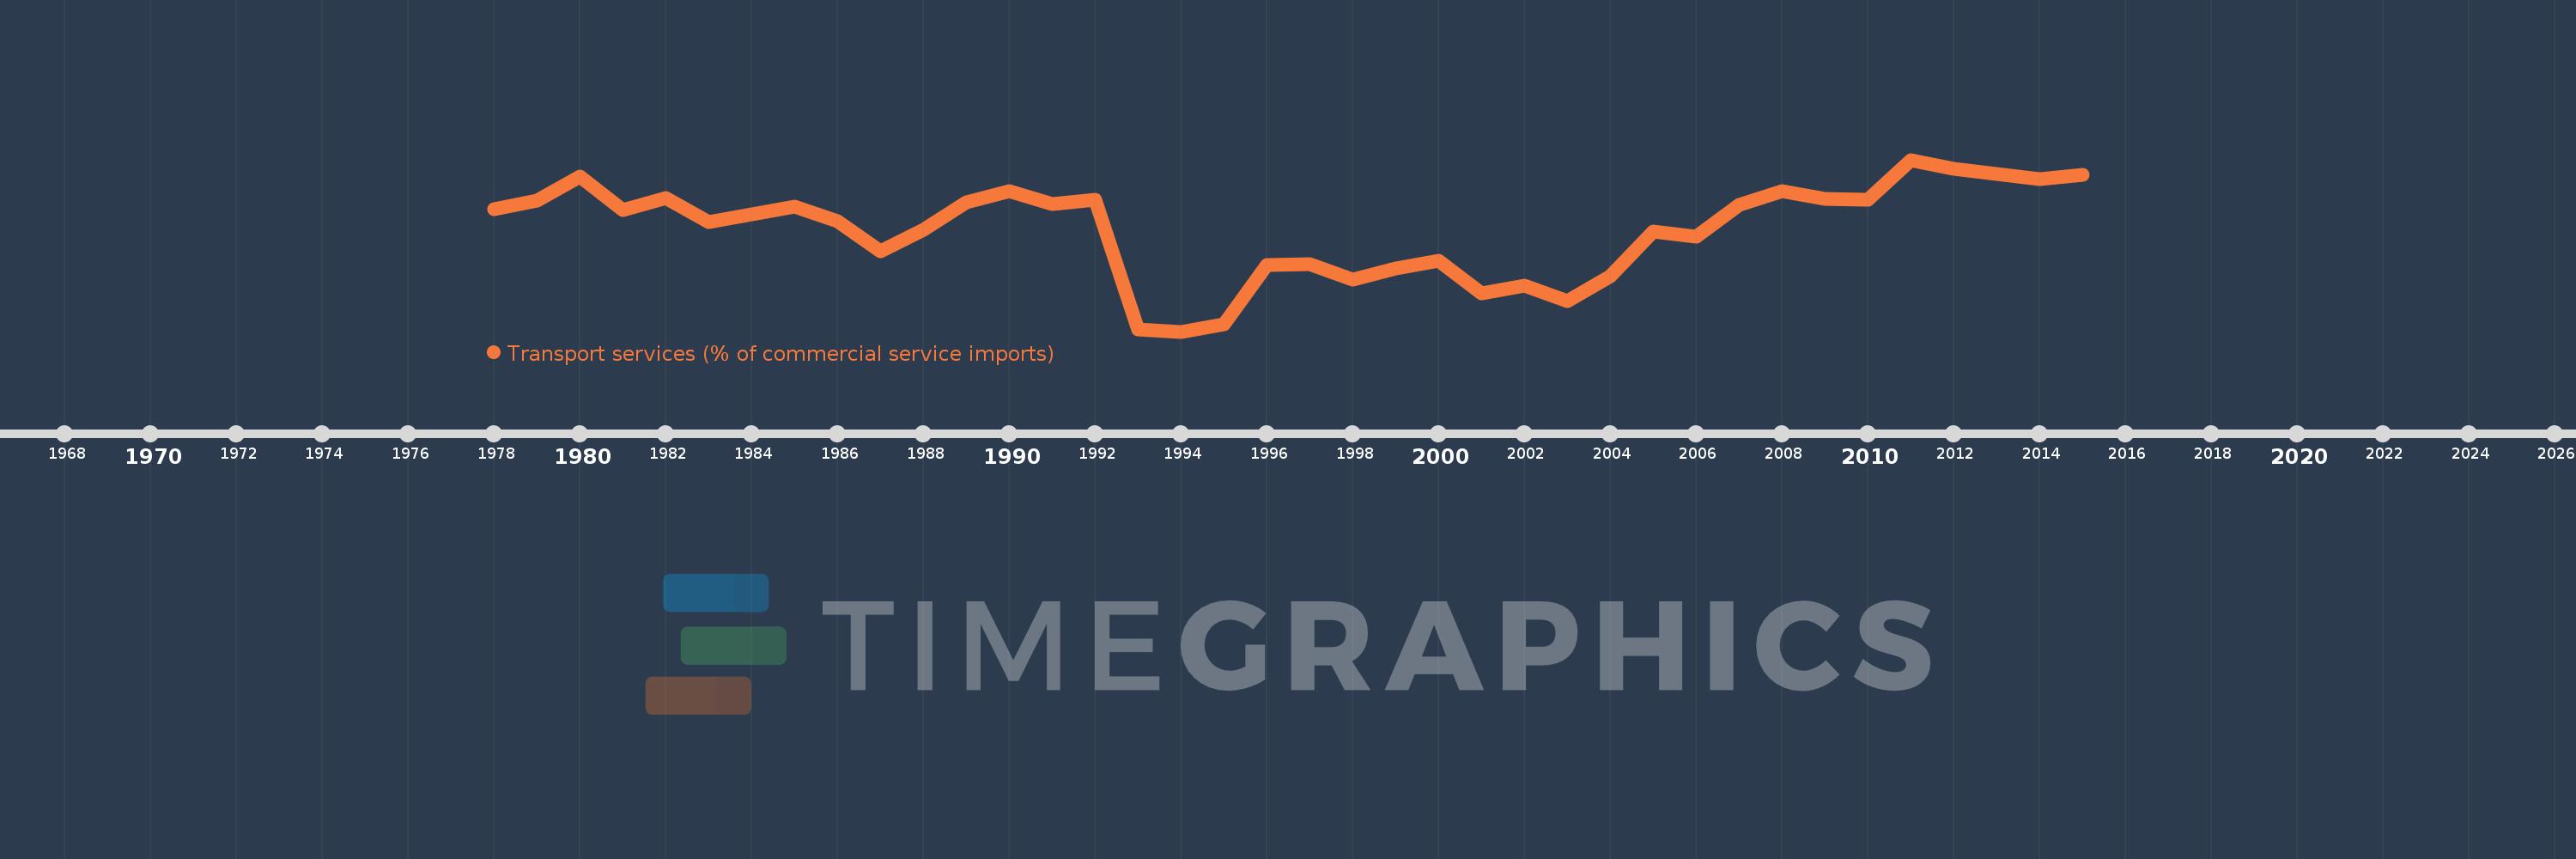
Transport services (% of commercial service imports)
2015,2014,2013,2012,2011,2010,2009,2008,2007,2006,2005,2004,2003,2002,2001,2000,1999,1998,1997,1996,1995,1994,1993,1992,1991,1990,1989,1988,1987,1986,1985,1984,1983,1982,1981,1980,1979,1978
Estas estatísticas em outros países:
AfghanistanAlbaniaAlgeriaAngolaAntigua and BarbudaArab WorldArgentinaArmeniaArubaAustraliaAustriaAzerbaijanBahamas, TheBahrainBangladeshBarbadosBelarusBelgiumBelizeBeninBermudaBhutanBoliviaBosnia and HerzegovinaBotswanaBrazilBrunei DarussalamBulgariaBurkina FasoBurundiCabo VerdeCambodiaCameroonCanadaCaribbean small statesCentral African RepublicCentral Europe and the BalticsChadChileChinaColombiaComorosCongo, Dem. Rep.Congo, Rep.Costa RicaCote d'IvoireCroatiaCuracaoCyprusCzech RepublicDenmarkDjiboutiDominicaDominican RepublicEarly-demographic dividendEast Asia & PacificEast Asia & Pacific (excluding high income)East Asia & Pacific (IDA & IBRD countries)EcuadorEgypt, Arab Rep.El SalvadorEquatorial GuineaEritreaEstoniaEthiopiaEuro areaEurope & Central AsiaEurope & Central Asia (excluding high income)Europe & Central Asia (IDA & IBRD countries)European UnionFaroe IslandsFijiFinlandFragile and conflict affected situationsFranceFrench PolynesiaGabonGambia, TheGeorgiaGermanyGhanaGreeceGrenadaGuatemalaGuineaGuinea-BissauGuyanaHaitiHeavily indebted poor countries (HIPC)High incomeHondurasHong Kong SAR, ChinaHungaryIBRD onlyIcelandIDA & IBRD totalIDA onlyIDA totalIndiaIndonesiaIran, Islamic Rep.IraqIrelandIsraelItalyJamaicaJapanJordanKazakhstanKenyaKiribatiKorea, Rep.KosovoKuwaitKyrgyz RepublicLao PDRLate-demographic dividendLatin America & Caribbean Latin America & Caribbean (excluding high income)Latin America & the Caribbean (IDA & IBRD countries)LatviaLeast developed countries: UN classificationLebanonLesothoLiberiaLibyaLithuaniaLow & middle incomeLow incomeLower middle incomeLuxembourgMacao SAR, ChinaMacedonia, FYRMadagascarMalawiMalaysiaMaldivesMaliMaltaMarshall IslandsMauritaniaMauritiusMexicoMicronesia, Fed. Sts.Middle East & North AfricaMiddle East & North Africa (excluding high income)Middle East & North Africa (IDA & IBRD countries)Middle incomeMoldovaMongoliaMontenegroMoroccoMozambiqueMyanmarNamibiaNepalNetherlandsNew CaledoniaNew ZealandNicaraguaNigerNigeriaNorth AmericaNorwayOECD membersOmanOther small statesPacific island small statesPakistanPalauPanamaPapua New GuineaParaguayPeruPhilippinesPolandPortugalPost-demographic dividendPre-demographic dividendQatarRomaniaRussian FederationRwandaSamoaSao Tome and PrincipeSaudi ArabiaSenegalSerbiaSeychellesSierra LeoneSingaporeSint Maarten (Dutch part)Slovak RepublicSloveniaSmall statesSolomon IslandsSouth AfricaSouth AsiaSouth Asia (IDA & IBRD)South SudanSpainSri LankaSt. Kitts and NevisSt. LuciaSt. Vincent and the GrenadinesSub-Saharan Africa Sub-Saharan Africa (excluding high income)Sub-Saharan Africa (IDA & IBRD countries)SudanSurinameSwazilandSwedenSwitzerlandSyrian Arab RepublicTajikistanTanzaniaThailandTimor-LesteTogoTongaTrinidad and TobagoTunisiaTurkeyTuvaluUgandaUkraineUnited KingdomUnited StatesUpper middle incomeUruguayVanuatuVenezuela, RBWest Bank and GazaWorldYemen, Rep.ZambiaZimbabwe Linha do tempo:
Nesta escala de tempo está apresentado um gráfico de 1978 ano até 2015 ano Egypt, Arab Rep.. Dados de 1977 ano ausente. O número de observações reais por data: 38.
Fonte (nome):
Indicadores de desenvolvimento mundial
Fonte (organização):
International Monetary Fund, Balance of Payments Statistics Yearbook and data files.
Categorias:
Private Sector, Trade
Foi atualizado:
23 abr 2017 ano
Indicadores de alterações dos valores ao longo dos anos
Mínimo:
25.194
1 jan 1994 ano
Máximo:
50.615
1 jan 2011 ano
Na data de observação
Valor
Mudança absoluta
A alteração em relação ao valor anterior
1 jan 1978 ano
43.343
+43.343
0.0%
1 jan 1979 ano
44.556
+1.214
2.8%
1 jan 1980 ano
48.193
+3.637
8.16%
1 jan 1981 ano
43.226
-4.967
-10.31%
1 jan 1982 ano
44.967
+1.741
4.03%
1 jan 1983 ano
41.377
-3.59
-7.98%
1 jan 1984 ano
42.572
+1.195
2.89%
1 jan 1985 ano
43.733
+1.161
2.73%
1 jan 1986 ano
41.475
-2.258
-5.16%
1 jan 1987 ano
37.07
-4.406
-10.62%
1 jan 1988 ano
40.296
+3.227
8.7%
1 jan 1989 ano
44.318
+4.022
9.98%
1 jan 1990 ano
45.942
+1.624
3.66%
1 jan 1991 ano
44.025
-1.917
-4.17%
1 jan 1992 ano
44.696
+0.671
1.52%
1 jan 1993 ano
25.57
-19.126
-42.79%
1 jan 1994 ano
25.194
-0.377
-1.47%
1 jan 1995 ano
26.254
+1.061
4.21%
1 jan 1996 ano
35.07
+8.816
33.58%
1 jan 1997 ano
35.145
+0.076
0.22%
1 jan 1998 ano
32.9
-2.245
-6.39%
1 jan 1999 ano
34.54
+1.639
4.98%
1 jan 2000 ano
35.709
+1.17
3.39%
1 jan 2001 ano
30.89
-4.82
-13.5%
1 jan 2002 ano
32.053
+1.164
3.77%
1 jan 2003 ano
29.643
-2.41
-7.52%
1 jan 2004 ano
33.334
+3.691
12.45%
1 jan 2005 ano
39.978
+6.644
19.93%
1 jan 2006 ano
39.246
-0.732
-1.83%
1 jan 2007 ano
43.983
+4.737
12.07%
1 jan 2008 ano
45.978
+1.994
4.53%
1 jan 2009 ano
44.82
-1.157
-2.52%
1 jan 2010 ano
44.663
-0.157
-0.35%
1 jan 2011 ano
50.615
+5.952
13.33%
1 jan 2012 ano
49.311
-1.304
-2.58%
1 jan 2013 ano
48.556
-0.756
-1.53%
1 jan 2014 ano
47.707
-0.848
-1.75%
1 jan 2015 ano
48.361
+0.654
1.37%
Classificação de países por estatísticas atuais por anos


Comentários: