29
/pt/
pt
AIzaSyAYiBZKx7MnpbEhh9jyipgxe19OcubqV5w
April 1, 2024
270021
Turkey
TUR
true
2
1
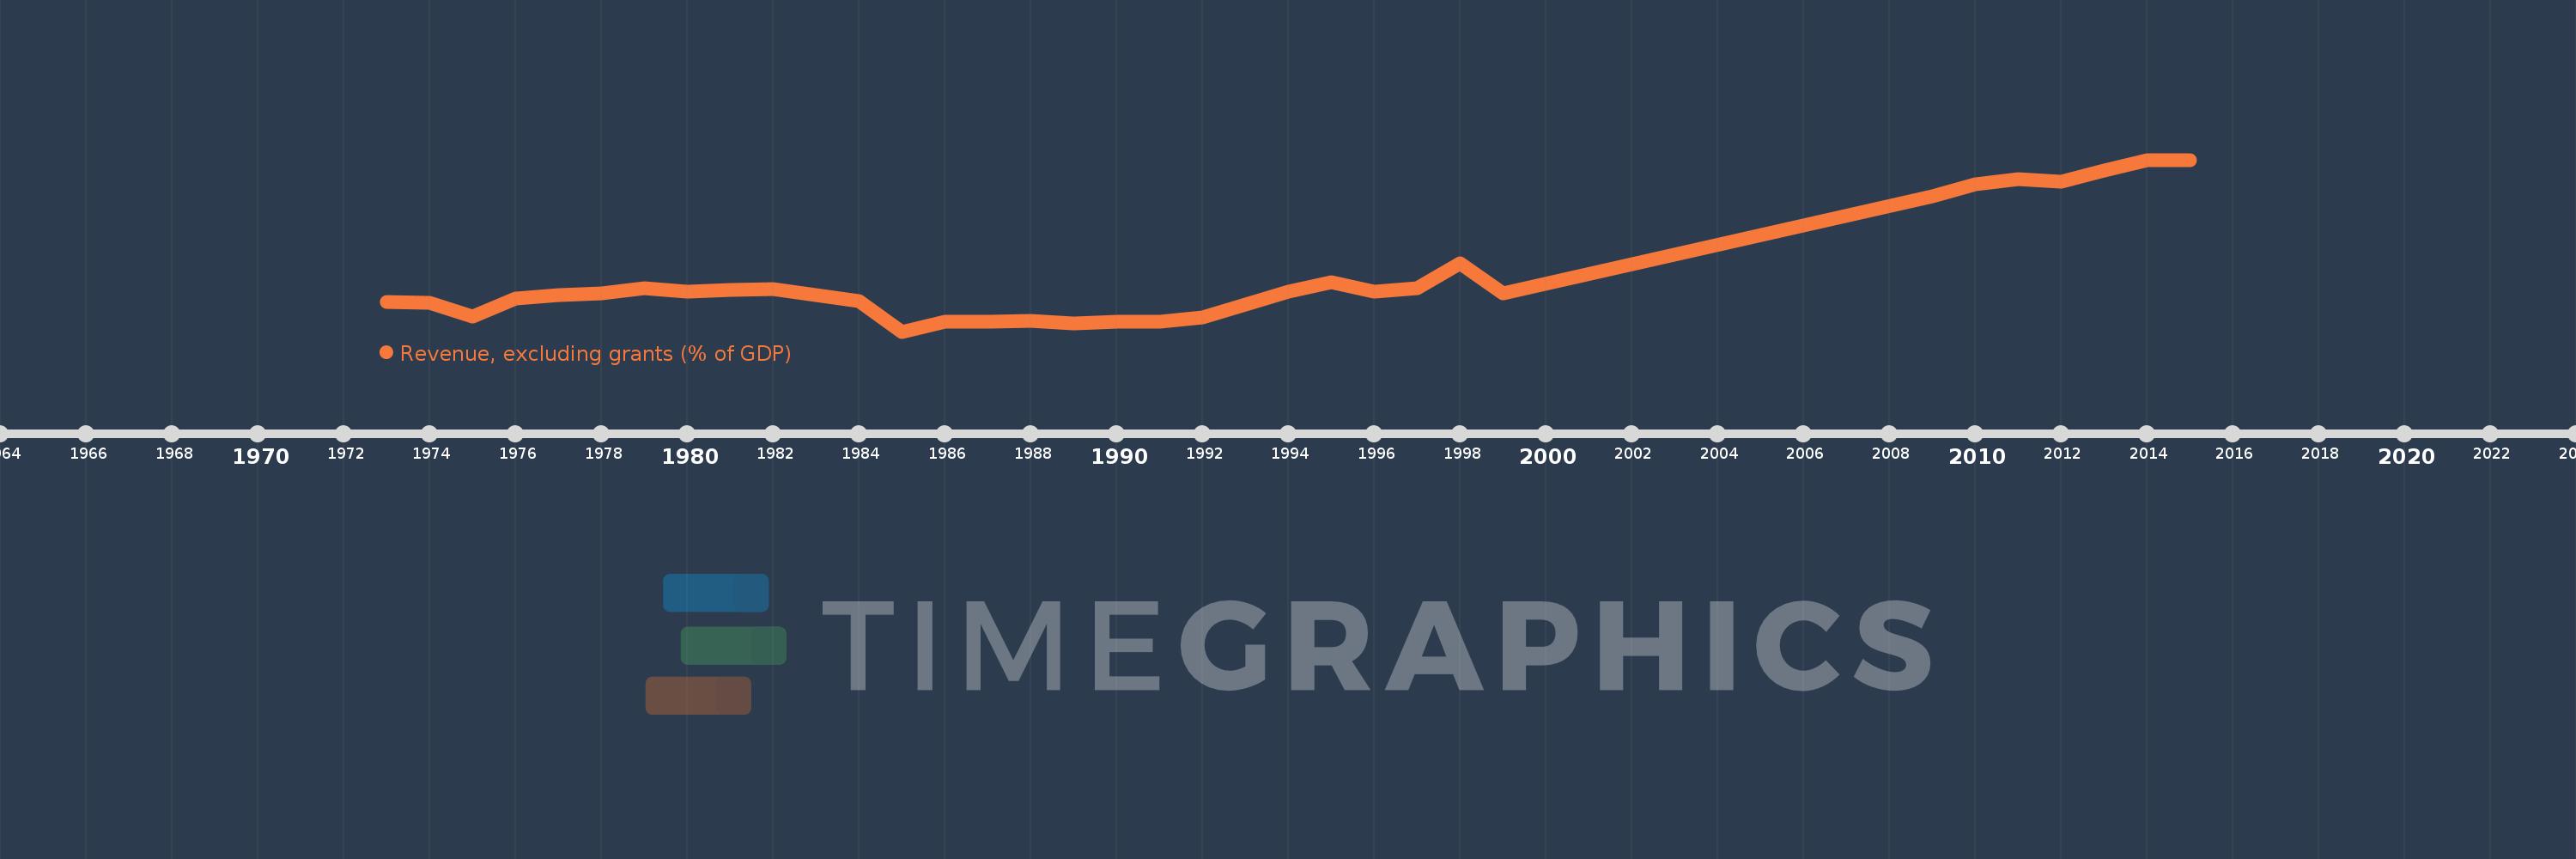
Revenue, excluding grants (% of GDP)
2015,2014,2013,2012,2011,2010,2009,1999,1998,1997,1996,1995,1994,1993,1992,1991,1990,1989,1988,1987,1986,1985,1984,1982,1981,1980,1979,1978,1977,1976,1975,1974,1973
Estas estatísticas em outros países:
AfghanistanAlbaniaAlgeriaAngolaAntigua and BarbudaArgentinaArmeniaAustraliaAustriaAzerbaijanBahamas, TheBahrainBangladeshBarbadosBelarusBelgiumBelizeBeninBhutanBoliviaBosnia and HerzegovinaBotswanaBrazilBulgariaBurkina FasoBurundiCabo VerdeCambodiaCanadaCaribbean small statesCentral African RepublicCentral Europe and the BalticsChileChinaColombiaCongo, Dem. Rep.Congo, Rep.Costa RicaCote d'IvoireCroatiaCyprusCzech RepublicDenmarkDominicaDominican RepublicEarly-demographic dividendEast Asia & PacificEast Asia & Pacific (excluding high income)East Asia & Pacific (IDA & IBRD countries)Egypt, Arab Rep.El SalvadorEquatorial GuineaEstoniaEthiopiaEuro areaEurope & Central AsiaEurope & Central Asia (excluding high income)Europe & Central Asia (IDA & IBRD countries)European UnionFijiFinlandFranceGambia, TheGeorgiaGermanyGhanaGreeceGrenadaGuatemalaHeavily indebted poor countries (HIPC)High incomeHondurasHong Kong SAR, ChinaHungaryIBRD onlyIcelandIDA & IBRD totalIDA blendIDA onlyIDA totalIndiaIndonesiaIran, Islamic Rep.IraqIrelandIsraelItalyJamaicaJapanJordanKazakhstanKenyaKiribatiKorea, Rep.KuwaitKyrgyz RepublicLao PDRLate-demographic dividendLatin America & Caribbean Latin America & Caribbean (excluding high income)Latin America & the Caribbean (IDA & IBRD countries)LatviaLeast developed countries: UN classificationLebanonLesothoLiberiaLithuaniaLow & middle incomeLow incomeLower middle incomeLuxembourgMacao SAR, ChinaMacedonia, FYRMadagascarMalawiMalaysiaMaldivesMaliMaltaMauritiusMexicoMicronesia, Fed. Sts.Middle East & North Africa (excluding high income)Middle East & North Africa (IDA & IBRD countries)Middle incomeMoldovaMongoliaMoroccoMozambiqueMyanmarNamibiaNepalNetherlandsNew ZealandNicaraguaNigeriaNorth AmericaNorwayOECD membersOmanOther small statesPacific island small statesPakistanPanamaPapua New GuineaParaguayPeruPhilippinesPolandPortugalPost-demographic dividendPre-demographic dividendQatarRomaniaRussian FederationRwandaSamoaSan MarinoSao Tome and PrincipeSenegalSerbiaSeychellesSierra LeoneSingaporeSlovak RepublicSloveniaSmall statesSolomon IslandsSouth AfricaSouth AsiaSouth Asia (IDA & IBRD)SpainSri LankaSt. Kitts and NevisSt. LuciaSt. Vincent and the GrenadinesSub-Saharan Africa Sub-Saharan Africa (excluding high income)Sub-Saharan Africa (IDA & IBRD countries)SurinameSwazilandSwedenSwitzerlandSyrian Arab RepublicTajikistanTanzaniaThailandTimor-LesteTogoTrinidad and TobagoTunisiaTurkeyUgandaUkraineUnited Arab EmiratesUnited KingdomUnited StatesUpper middle incomeUruguayVanuatuVenezuela, RBVietnamWest Bank and GazaWorldYemen, Rep.ZambiaZimbabwe Linha do tempo:
Nesta escala de tempo está apresentado um gráfico de 1973 ano até 2015 ano Turkey. Dados de 1972 ano ausente. O número de observações reais por data: 33.
Fonte (nome):
Indicadores de desenvolvimento mundial
Fonte (organização):
International Monetary Fund, Government Finance Statistics Yearbook and data files, and World Bank and OECD GDP estimates.
Categorias:
Economy & Growth, Public Sector
Foi atualizado:
23 abr 2017 ano
Indicadores de alterações dos valores ao longo dos anos
Mínimo:
12.328
1 jan 1985 ano
Máximo:
36.242
1 jan 2015 ano
Na data de observação
Valor
Mudança absoluta
A alteração em relação ao valor anterior
1 jan 1973 ano
16.396
+16.396
0.0%
1 jan 1974 ano
16.291
-0.105
-0.64%
1 jan 1975 ano
14.441
-1.85
-11.36%
1 jan 1976 ano
16.879
+2.437
16.88%
1 jan 1977 ano
17.456
+0.578
3.42%
1 jan 1978 ano
17.694
+0.238
1.36%
1 jan 1979 ano
18.421
+0.727
4.11%
1 jan 1980 ano
17.879
-0.542
-2.94%
1 jan 1981 ano
18.072
+0.193
1.08%
1 jan 1982 ano
18.27
+0.197
1.09%
1 jan 1984 ano
16.567
-1.703
-9.32%
1 jan 1985 ano
12.328
-4.239
-25.59%
1 jan 1986 ano
13.735
+1.407
11.41%
1 jan 1987 ano
13.736
+0.001
0.0%
1 jan 1988 ano
13.881
+0.145
1.05%
1 jan 1989 ano
13.507
-0.374
-2.69%
1 jan 1990 ano
13.675
+0.168
1.24%
1 jan 1991 ano
13.656
-0.019
-0.14%
1 jan 1992 ano
14.299
+0.644
4.71%
1 jan 1993 ano
16.057
+1.758
12.29%
1 jan 1994 ano
17.852
+1.794
11.17%
1 jan 1995 ano
19.259
+1.408
7.89%
1 jan 1996 ano
17.94
-1.32
-6.85%
1 jan 1997 ano
18.339
+0.399
2.22%
1 jan 1998 ano
21.877
+3.538
19.3%
1 jan 1999 ano
17.646
-4.231
-19.34%
1 jan 2009 ano
31.166
+13.52
76.62%
1 jan 2010 ano
32.799
+1.633
5.24%
1 jan 2011 ano
33.5
+0.701
2.14%
1 jan 2012 ano
33.235
-0.265
-0.79%
1 jan 2013 ano
34.699
+1.464
4.4%
1 jan 2014 ano
36.124
+1.425
4.11%
1 jan 2015 ano
36.242
+0.118
0.33%
Classificação de países por estatísticas atuais por anos


Comentários: