29
/pt/
pt
AIzaSyAYiBZKx7MnpbEhh9jyipgxe19OcubqV5w
April 1, 2024
112939
Costa Rica
CRI
true
2
1
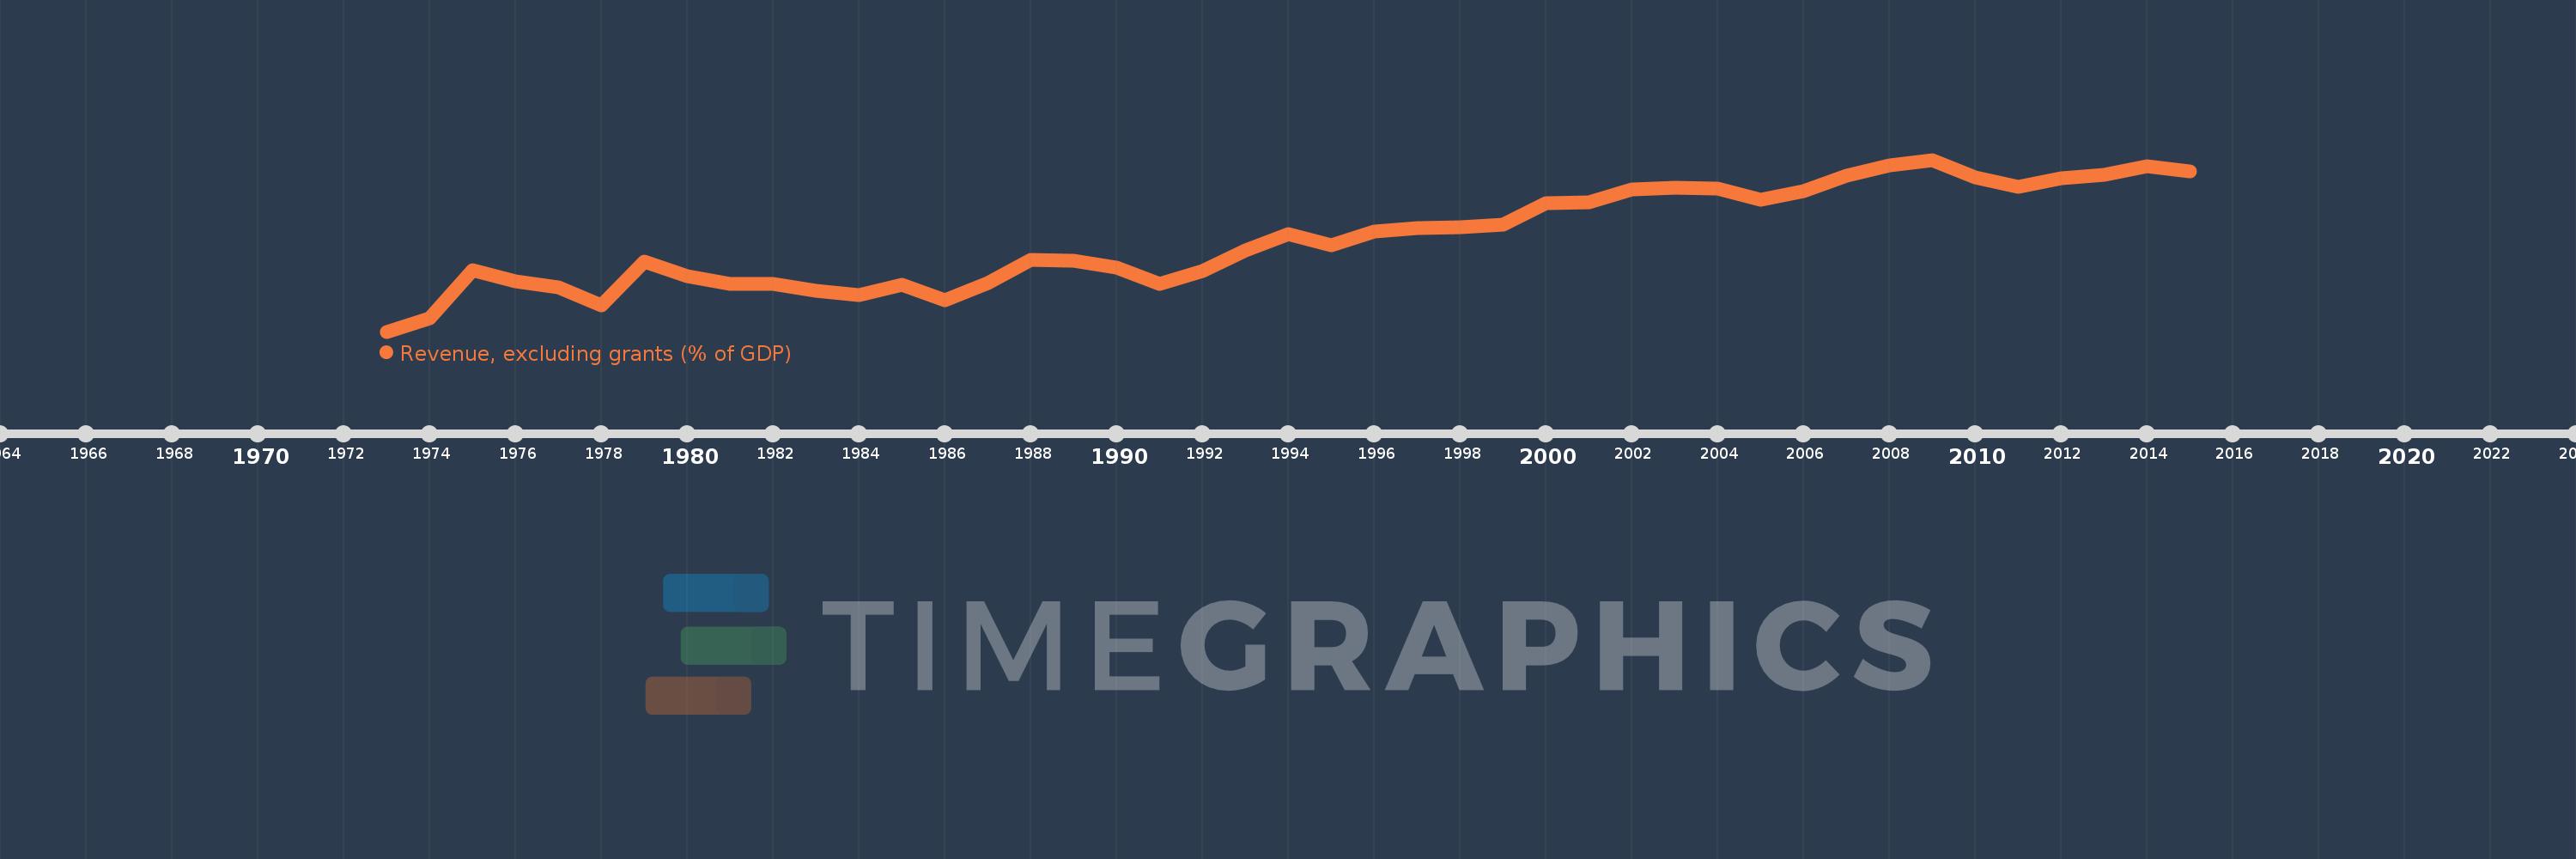
Revenue, excluding grants (% of GDP)
2015,2014,2013,2012,2011,2010,2009,2008,2007,2006,2005,2004,2003,2002,2001,2000,1999,1998,1997,1996,1995,1994,1993,1992,1991,1990,1989,1988,1987,1986,1985,1984,1983,1982,1981,1980,1979,1978,1977,1976,1975,1974,1973
Estas estatísticas em outros países:
AfghanistanAlbaniaAlgeriaAngolaAntigua and BarbudaArgentinaArmeniaAustraliaAustriaAzerbaijanBahamas, TheBahrainBangladeshBarbadosBelarusBelgiumBelizeBeninBhutanBoliviaBosnia and HerzegovinaBotswanaBrazilBulgariaBurkina FasoBurundiCabo VerdeCambodiaCanadaCaribbean small statesCentral African RepublicCentral Europe and the BalticsChileChinaColombiaCongo, Dem. Rep.Congo, Rep.Costa RicaCote d'IvoireCroatiaCyprusCzech RepublicDenmarkDominicaDominican RepublicEarly-demographic dividendEast Asia & PacificEast Asia & Pacific (excluding high income)East Asia & Pacific (IDA & IBRD countries)Egypt, Arab Rep.El SalvadorEquatorial GuineaEstoniaEthiopiaEuro areaEurope & Central AsiaEurope & Central Asia (excluding high income)Europe & Central Asia (IDA & IBRD countries)European UnionFijiFinlandFranceGambia, TheGeorgiaGermanyGhanaGreeceGrenadaGuatemalaHeavily indebted poor countries (HIPC)High incomeHondurasHong Kong SAR, ChinaHungaryIBRD onlyIcelandIDA & IBRD totalIDA blendIDA onlyIDA totalIndiaIndonesiaIran, Islamic Rep.IraqIrelandIsraelItalyJamaicaJapanJordanKazakhstanKenyaKiribatiKorea, Rep.KuwaitKyrgyz RepublicLao PDRLate-demographic dividendLatin America & Caribbean Latin America & Caribbean (excluding high income)Latin America & the Caribbean (IDA & IBRD countries)LatviaLeast developed countries: UN classificationLebanonLesothoLiberiaLithuaniaLow & middle incomeLow incomeLower middle incomeLuxembourgMacao SAR, ChinaMacedonia, FYRMadagascarMalawiMalaysiaMaldivesMaliMaltaMauritiusMexicoMicronesia, Fed. Sts.Middle East & North Africa (excluding high income)Middle East & North Africa (IDA & IBRD countries)Middle incomeMoldovaMongoliaMoroccoMozambiqueMyanmarNamibiaNepalNetherlandsNew ZealandNicaraguaNigeriaNorth AmericaNorwayOECD membersOmanOther small statesPacific island small statesPakistanPanamaPapua New GuineaParaguayPeruPhilippinesPolandPortugalPost-demographic dividendPre-demographic dividendQatarRomaniaRussian FederationRwandaSamoaSan MarinoSao Tome and PrincipeSenegalSerbiaSeychellesSierra LeoneSingaporeSlovak RepublicSloveniaSmall statesSolomon IslandsSouth AfricaSouth AsiaSouth Asia (IDA & IBRD)SpainSri LankaSt. Kitts and NevisSt. LuciaSt. Vincent and the GrenadinesSub-Saharan Africa Sub-Saharan Africa (excluding high income)Sub-Saharan Africa (IDA & IBRD countries)SurinameSwazilandSwedenSwitzerlandSyrian Arab RepublicTajikistanTanzaniaThailandTimor-LesteTogoTrinidad and TobagoTunisiaTurkeyUgandaUkraineUnited Arab EmiratesUnited KingdomUnited StatesUpper middle incomeUruguayVanuatuVenezuela, RBVietnamWest Bank and GazaWorldYemen, Rep.ZambiaZimbabwe Linha do tempo:
Nesta escala de tempo está apresentado um gráfico de 1973 ano até 2015 ano Costa Rica. Dados de 1972 ano ausente. O número de observações reais por data: 43.
Fonte (nome):
Indicadores de desenvolvimento mundial
Fonte (organização):
International Monetary Fund, Government Finance Statistics Yearbook and data files, and World Bank and OECD GDP estimates.
Categorias:
Economy & Growth, Public Sector
Foi atualizado:
23 abr 2017 ano
Indicadores de alterações dos valores ao longo dos anos
Mínimo:
15.215
1 jan 1973 ano
Máximo:
24.558
1 jan 2009 ano
Na data de observação
Valor
Mudança absoluta
A alteração em relação ao valor anterior
1 jan 1973 ano
15.215
+15.215
0.0%
1 jan 1974 ano
15.941
+0.727
4.78%
1 jan 1975 ano
18.539
+2.597
16.29%
1 jan 1976 ano
17.971
-0.567
-3.06%
1 jan 1977 ano
17.605
-0.366
-2.04%
1 jan 1978 ano
16.635
-0.971
-5.51%
1 jan 1979 ano
19.01
+2.376
14.28%
1 jan 1980 ano
18.245
-0.765
-4.03%
1 jan 1981 ano
17.8
-0.446
-2.44%
1 jan 1982 ano
17.828
+0.028
0.16%
1 jan 1983 ano
17.435
-0.393
-2.2%
1 jan 1984 ano
17.184
-0.251
-1.44%
1 jan 1985 ano
17.783
+0.599
3.49%
1 jan 1986 ano
16.93
-0.853
-4.79%
1 jan 1987 ano
17.85
+0.919
5.43%
1 jan 1988 ano
19.114
+1.264
7.08%
1 jan 1989 ano
19.087
-0.026
-0.14%
1 jan 1990 ano
18.684
-0.403
-2.11%
1 jan 1991 ano
17.81
-0.875
-4.68%
1 jan 1992 ano
18.517
+0.707
3.97%
1 jan 1993 ano
19.633
+1.116
6.03%
1 jan 1994 ano
20.494
+0.861
4.39%
1 jan 1995 ano
19.906
-0.588
-2.87%
1 jan 1996 ano
20.666
+0.759
3.81%
1 jan 1997 ano
20.86
+0.195
0.94%
1 jan 1998 ano
20.871
+0.01
0.05%
1 jan 1999 ano
21.017
+0.146
0.7%
1 jan 2000 ano
22.181
+1.164
5.54%
1 jan 2001 ano
22.255
+0.074
0.33%
1 jan 2002 ano
22.952
+0.697
3.13%
1 jan 2003 ano
23.023
+0.07
0.31%
1 jan 2004 ano
22.983
-0.039
-0.17%
1 jan 2005 ano
22.406
-0.577
-2.51%
1 jan 2006 ano
22.87
+0.464
2.07%
1 jan 2007 ano
23.685
+0.815
3.56%
1 jan 2008 ano
24.239
+0.554
2.34%
1 jan 2009 ano
24.558
+0.319
1.32%
1 jan 2010 ano
23.605
-0.954
-3.88%
1 jan 2011 ano
23.107
-0.498
-2.11%
1 jan 2012 ano
23.573
+0.466
2.02%
1 jan 2013 ano
23.743
+0.17
0.72%
1 jan 2014 ano
24.211
+0.468
1.97%
1 jan 2015 ano
23.921
-0.29
-1.2%
Classificação de países por estatísticas atuais por anos


Comentários: