29
/pt/
pt
AIzaSyAYiBZKx7MnpbEhh9jyipgxe19OcubqV5w
April 1, 2024
267194
Trinidad and Tobago
TTO
true
2
1
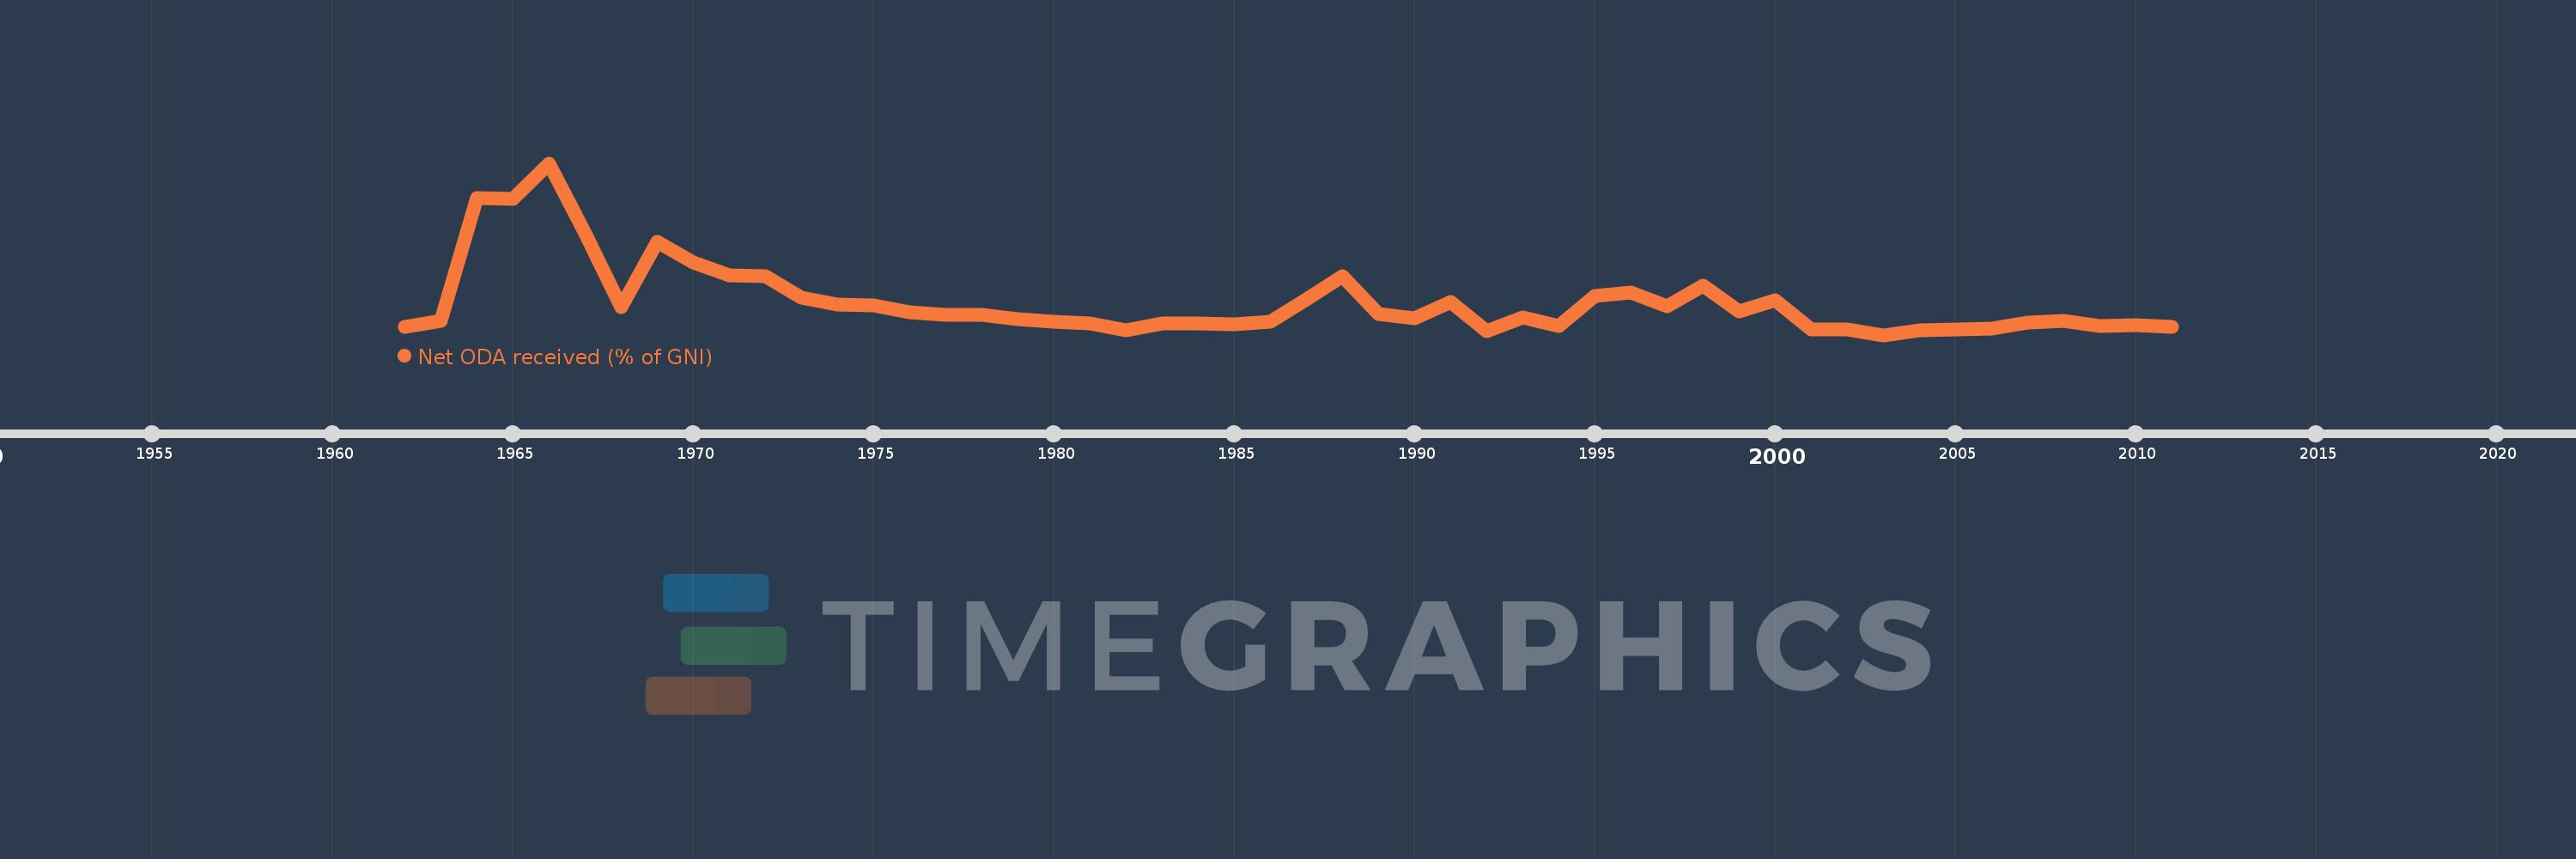
Net ODA received (% of GNI)
2011,2010,2009,2008,2007,2006,2005,2004,2003,2002,2001,2000,1999,1998,1997,1996,1995,1994,1993,1992,1991,1990,1989,1988,1987,1986,1985,1984,1983,1982,1981,1980,1979,1978,1977,1976,1975,1974,1973,1972,1971,1970,1969,1968,1967,1966,1965,1964,1963,1962
Estas estatísticas em outros países:
AfghanistanAlbaniaAlgeriaAngolaAntigua and BarbudaArab WorldArgentinaArmeniaAzerbaijanBahamas, TheBahrainBangladeshBarbadosBelarusBelizeBeninBermudaBhutanBoliviaBosnia and HerzegovinaBotswanaBrazilBrunei DarussalamBurkina FasoBurundiCabo VerdeCambodiaCameroonCaribbean small statesCentral African RepublicCentral Europe and the BalticsChadChileChinaColombiaComorosCongo, Dem. Rep.Congo, Rep.Costa RicaCote d'IvoireCroatiaCubaCyprusDjiboutiDominicaDominican RepublicEast Asia & PacificEast Asia & Pacific (excluding high income)East Asia & Pacific (IDA & IBRD countries)EcuadorEgypt, Arab Rep.El SalvadorEquatorial GuineaEritreaEthiopiaEuro areaEurope & Central AsiaEurope & Central Asia (excluding high income)Europe & Central Asia (IDA & IBRD countries)European UnionFijiFragile and conflict affected situationsFrench PolynesiaGabonGambia, TheGeorgiaGhanaGrenadaGuatemalaGuineaGuinea-BissauGuyanaHaitiHeavily indebted poor countries (HIPC)High incomeHondurasHong Kong SAR, ChinaIBRD onlyIDA & IBRD totalIDA blendIDA onlyIDA totalIndiaIndonesiaIran, Islamic Rep.IraqIsraelJamaicaJordanKazakhstanKenyaKiribatiKorea, Rep.KosovoKuwaitKyrgyz RepublicLao PDRLatin America & Caribbean Latin America & Caribbean (excluding high income)Latin America & the Caribbean (IDA & IBRD countries)Least developed countries: UN classificationLebanonLesothoLiberiaLibyaLow & middle incomeLow incomeLower middle incomeMacao SAR, ChinaMacedonia, FYRMadagascarMalawiMalaysiaMaldivesMaliMaltaMarshall IslandsMauritaniaMauritiusMexicoMicronesia, Fed. Sts.Middle East & North AfricaMiddle East & North Africa (excluding high income)Middle East & North Africa (IDA & IBRD countries)Middle incomeMoldovaMongoliaMontenegroMoroccoMozambiqueMyanmarNamibiaNauruNepalNew CaledoniaNicaraguaNigerNigeriaNorth AmericaOECD membersOmanOther small statesPacific island small statesPakistanPalauPanamaPapua New GuineaParaguayPeruPhilippinesQatarRwandaSamoaSao Tome and PrincipeSaudi ArabiaSenegalSerbiaSeychellesSierra LeoneSingaporeSloveniaSmall statesSolomon IslandsSomaliaSouth AfricaSouth AsiaSouth Asia (IDA & IBRD)South SudanSri LankaSt. Kitts and NevisSt. LuciaSt. Vincent and the GrenadinesSub-Saharan Africa Sub-Saharan Africa (excluding high income)Sub-Saharan Africa (IDA & IBRD countries)SudanSurinameSwazilandSyrian Arab RepublicTajikistanTanzaniaThailandTimor-LesteTogoTongaTrinidad and TobagoTunisiaTurkeyTurkmenistanTuvaluUgandaUkraineUpper middle incomeUruguayUzbekistanVanuatuVenezuela, RBVietnamWest Bank and GazaWorldYemen, Rep.ZambiaZimbabwe Linha do tempo:
Nesta escala de tempo está apresentado um gráfico de 1962 ano até 2011 ano Trinidad and Tobago. Dados de 1961 ano ausente. O número de observações reais por data: 50.
Fonte (nome):
Indicadores de desenvolvimento mundial
Fonte (organização):
Development Assistance Committee of the Organisation for Economic Co-operation and Development, Geographical Distribution of Financial Flows to Developing Countries, Development Co-operation Report, and International Development Statistics database. Data are available online at: www.oecd.org/dac/stats/idsonline. World Bank GNI estimates are used for the denominator.
Categorias:
Aid Effectiveness, Economy & Growth, External Debt
Foi atualizado:
23 abr 2017 ano
Indicadores de alterações dos valores ao longo dos anos
Mínimo:
-0.101
1 jan 2003 ano
Máximo:
2.387
1 jan 1966 ano
Na data de observação
Valor
Mudança absoluta
A alteração em relação ao valor anterior
1 jan 1962 ano
0.015
+0.015
0.0%
1 jan 1963 ano
0.099
+0.084
544.28%
1 jan 1964 ano
1.877
+1.778
1.79 mil%
1 jan 1965 ano
1.868
-0.01
-0.51%
1 jan 1966 ano
2.387
+0.519
27.81%
1 jan 1967 ano
1.379
-1.008
-42.21%
1 jan 1968 ano
0.309
-1.071
-77.63%
1 jan 1969 ano
1.248
+0.94
304.43%
1 jan 1970 ano
0.947
-0.301
-24.14%
1 jan 1971 ano
0.764
-0.183
-19.34%
1 jan 1972 ano
0.753
-0.011
-1.39%
1 jan 1973 ano
0.434
-0.32
-42.44%
1 jan 1974 ano
0.345
-0.088
-20.39%
1 jan 1975 ano
0.326
-0.02
-5.67%
1 jan 1976 ano
0.228
-0.097
-29.83%
1 jan 1977 ano
0.197
-0.032
-13.81%
1 jan 1978 ano
0.187
-0.01
-5.17%
1 jan 1979 ano
0.128
-0.059
-31.46%
1 jan 1980 ano
0.093
-0.035
-27.04%
1 jan 1981 ano
0.066
-0.027
-28.92%
1 jan 1982 ano
-0.03
-0.097
-145.7%
1 jan 1983 ano
0.066
+0.096
-317.17%
1 jan 1984 ano
0.068
+0.002
3.51%
1 jan 1985 ano
0.059
-0.009
-13.63%
1 jan 1986 ano
0.093
+0.034
57.1%
1 jan 1987 ano
0.417
+0.324
350.56%
1 jan 1988 ano
0.757
+0.34
81.61%
1 jan 1989 ano
0.201
-0.556
-73.48%
1 jan 1990 ano
0.146
-0.055
-27.2%
1 jan 1991 ano
0.38
+0.234
160.28%
1 jan 1992 ano
-0.046
-0.427
-112.19%
1 jan 1993 ano
0.153
+0.199
-429.94%
1 jan 1994 ano
0.034
-0.119
-78.05%
1 jan 1995 ano
0.466
+0.433
1.29 mil%
1 jan 1996 ano
0.511
+0.045
9.62%
1 jan 1997 ano
0.315
-0.196
-38.44%
1 jan 1998 ano
0.617
+0.302
95.99%
1 jan 1999 ano
0.242
-0.375
-60.81%
1 jan 2000 ano
0.409
+0.167
69.14%
1 jan 2001 ano
-0.02
-0.429
-104.97%
1 jan 2002 ano
-0.021
-0.001
2.7%
1 jan 2003 ano
-0.101
-0.08
381.83%
1 jan 2004 ano
-0.027
+0.073
-72.87%
1 jan 2005 ano
-0.014
+0.013
-48.53%
1 jan 2006 ano
-0.013
+0.001
-7.45%
1 jan 2007 ano
0.079
+0.092
-709.5%
1 jan 2008 ano
0.101
+0.021
26.95%
1 jan 2009 ano
0.035
-0.066
-65.34%
1 jan 2010 ano
0.038
+0.003
8.03%
1 jan 2011 ano
0.021
-0.017
-45.47%
Classificação de países por estatísticas atuais por anos


Comentários: