29
/pt/
pt
AIzaSyAYiBZKx7MnpbEhh9jyipgxe19OcubqV5w
April 1, 2024
252212
St. Vincent and the Grenadines
VCT
true
2
1
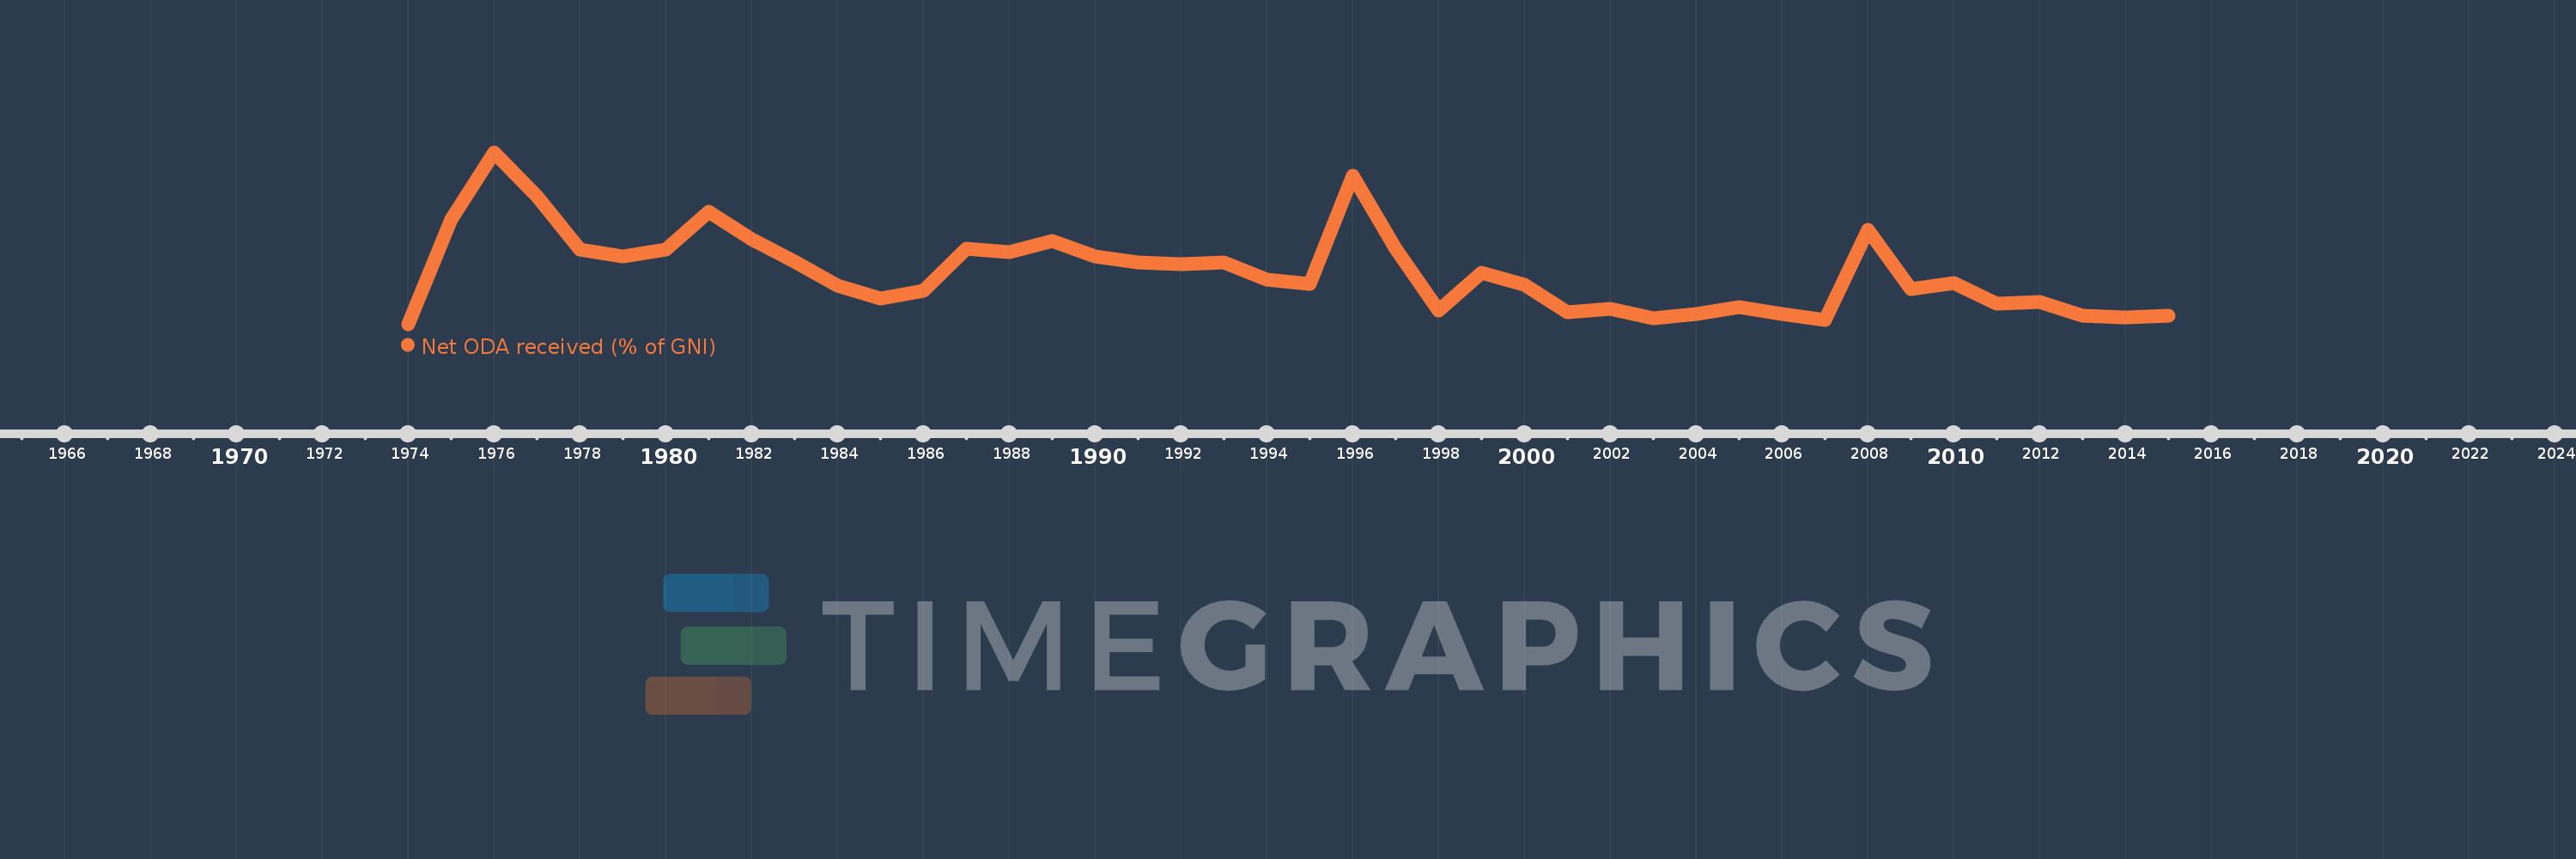
Net ODA received (% of GNI)
2015,2014,2013,2012,2011,2010,2009,2008,2007,2006,2005,2004,2003,2002,2001,2000,1999,1998,1997,1996,1995,1994,1993,1992,1991,1990,1989,1988,1987,1986,1985,1984,1983,1982,1981,1980,1979,1978,1977,1976,1975,1974
Estas estatísticas em outros países:
AfghanistanAlbaniaAlgeriaAngolaAntigua and BarbudaArab WorldArgentinaArmeniaAzerbaijanBahamas, TheBahrainBangladeshBarbadosBelarusBelizeBeninBermudaBhutanBoliviaBosnia and HerzegovinaBotswanaBrazilBrunei DarussalamBurkina FasoBurundiCabo VerdeCambodiaCameroonCaribbean small statesCentral African RepublicCentral Europe and the BalticsChadChileChinaColombiaComorosCongo, Dem. Rep.Congo, Rep.Costa RicaCote d'IvoireCroatiaCubaCyprusDjiboutiDominicaDominican RepublicEast Asia & PacificEast Asia & Pacific (excluding high income)East Asia & Pacific (IDA & IBRD countries)EcuadorEgypt, Arab Rep.El SalvadorEquatorial GuineaEritreaEthiopiaEuro areaEurope & Central AsiaEurope & Central Asia (excluding high income)Europe & Central Asia (IDA & IBRD countries)European UnionFijiFragile and conflict affected situationsFrench PolynesiaGabonGambia, TheGeorgiaGhanaGrenadaGuatemalaGuineaGuinea-BissauGuyanaHaitiHeavily indebted poor countries (HIPC)High incomeHondurasHong Kong SAR, ChinaIBRD onlyIDA & IBRD totalIDA blendIDA onlyIDA totalIndiaIndonesiaIran, Islamic Rep.IraqIsraelJamaicaJordanKazakhstanKenyaKiribatiKorea, Rep.KosovoKuwaitKyrgyz RepublicLao PDRLatin America & Caribbean Latin America & Caribbean (excluding high income)Latin America & the Caribbean (IDA & IBRD countries)Least developed countries: UN classificationLebanonLesothoLiberiaLibyaLow & middle incomeLow incomeLower middle incomeMacao SAR, ChinaMacedonia, FYRMadagascarMalawiMalaysiaMaldivesMaliMaltaMarshall IslandsMauritaniaMauritiusMexicoMicronesia, Fed. Sts.Middle East & North AfricaMiddle East & North Africa (excluding high income)Middle East & North Africa (IDA & IBRD countries)Middle incomeMoldovaMongoliaMontenegroMoroccoMozambiqueMyanmarNamibiaNauruNepalNew CaledoniaNicaraguaNigerNigeriaNorth AmericaOECD membersOmanOther small statesPacific island small statesPakistanPalauPanamaPapua New GuineaParaguayPeruPhilippinesQatarRwandaSamoaSao Tome and PrincipeSaudi ArabiaSenegalSerbiaSeychellesSierra LeoneSingaporeSloveniaSmall statesSolomon IslandsSomaliaSouth AfricaSouth AsiaSouth Asia (IDA & IBRD)South SudanSri LankaSt. Kitts and NevisSt. LuciaSt. Vincent and the GrenadinesSub-Saharan Africa Sub-Saharan Africa (excluding high income)Sub-Saharan Africa (IDA & IBRD countries)SudanSurinameSwazilandSyrian Arab RepublicTajikistanTanzaniaThailandTimor-LesteTogoTongaTrinidad and TobagoTunisiaTurkeyTurkmenistanTuvaluUgandaUkraineUpper middle incomeUruguayUzbekistanVanuatuVenezuela, RBVietnamWest Bank and GazaWorldYemen, Rep.ZambiaZimbabwe Linha do tempo:
Nesta escala de tempo está apresentado um gráfico de 1974 ano até 2015 ano St. Vincent and the Grenadines. Dados de 1973 ano ausente. O número de observações reais por data: 42.
Fonte (nome):
Indicadores de desenvolvimento mundial
Fonte (organização):
Development Assistance Committee of the Organisation for Economic Co-operation and Development, Geographical Distribution of Financial Flows to Developing Countries, Development Co-operation Report, and International Development Statistics database. Data are available online at: www.oecd.org/dac/stats/idsonline. World Bank GNI estimates are used for the denominator.
Categorias:
Aid Effectiveness, Economy & Growth, External Debt
Foi atualizado:
23 abr 2017 ano
Indicadores de alterações dos valores ao longo dos anos
Mínimo:
0.398
1 jan 1974 ano
Máximo:
17.992
1 jan 1976 ano
Na data de observação
Valor
Mudança absoluta
A alteração em relação ao valor anterior
1 jan 1974 ano
0.398
+0.398
0.0%
1 jan 1975 ano
11.116
+10.719
2.69 mil%
1 jan 1976 ano
17.992
+6.875
61.85%
1 jan 1977 ano
13.479
-4.513
-25.08%
1 jan 1978 ano
8.004
-5.475
-40.62%
1 jan 1979 ano
7.297
-0.706
-8.82%
1 jan 1980 ano
8.086
+0.788
10.8%
1 jan 1981 ano
11.911
+3.825
47.31%
1 jan 1982 ano
9.105
-2.805
-23.55%
1 jan 1983 ano
6.825
-2.28
-25.04%
1 jan 1984 ano
4.385
-2.44
-35.75%
1 jan 1985 ano
2.999
-1.386
-31.6%
1 jan 1986 ano
3.819
+0.82
27.33%
1 jan 1987 ano
8.143
+4.324
113.21%
1 jan 1988 ano
7.787
-0.356
-4.38%
1 jan 1989 ano
8.948
+1.161
14.91%
1 jan 1990 ano
7.36
-1.588
-17.75%
1 jan 1991 ano
6.702
-0.657
-8.93%
1 jan 1992 ano
6.543
-0.16
-2.38%
1 jan 1993 ano
6.723
+0.18
2.75%
1 jan 1994 ano
4.923
-1.8
-26.77%
1 jan 1995 ano
4.531
-0.392
-7.96%
1 jan 1996 ano
15.642
+11.111
245.21%
1 jan 1997 ano
8.161
-7.48
-47.82%
1 jan 1998 ano
1.76
-6.401
-78.43%
1 jan 1999 ano
5.696
+3.935
223.55%
1 jan 2000 ano
4.399
-1.297
-22.78%
1 jan 2001 ano
1.639
-2.76
-62.74%
1 jan 2002 ano
1.963
+0.325
19.81%
1 jan 2003 ano
1.029
-0.935
-47.61%
1 jan 2004 ano
1.415
+0.386
37.55%
1 jan 2005 ano
2.157
+0.742
52.43%
1 jan 2006 ano
1.476
-0.681
-31.58%
1 jan 2007 ano
0.808
-0.667
-45.21%
1 jan 2008 ano
10.033
+9.225
1.14 mil%
1 jan 2009 ano
3.994
-6.04
-60.2%
1 jan 2010 ano
4.647
+0.654
16.37%
1 jan 2011 ano
2.519
-2.128
-45.8%
1 jan 2012 ano
2.695
+0.176
6.97%
1 jan 2013 ano
1.242
-1.452
-53.9%
1 jan 2014 ano
1.089
-0.154
-12.37%
1 jan 2015 ano
1.267
+0.179
16.44%
Classificação de países por estatísticas atuais por anos


Comentários: