29
/pt/
pt
AIzaSyAYiBZKx7MnpbEhh9jyipgxe19OcubqV5w
April 1, 2024
258774
Syrian Arab Republic
SYR
true
2
1
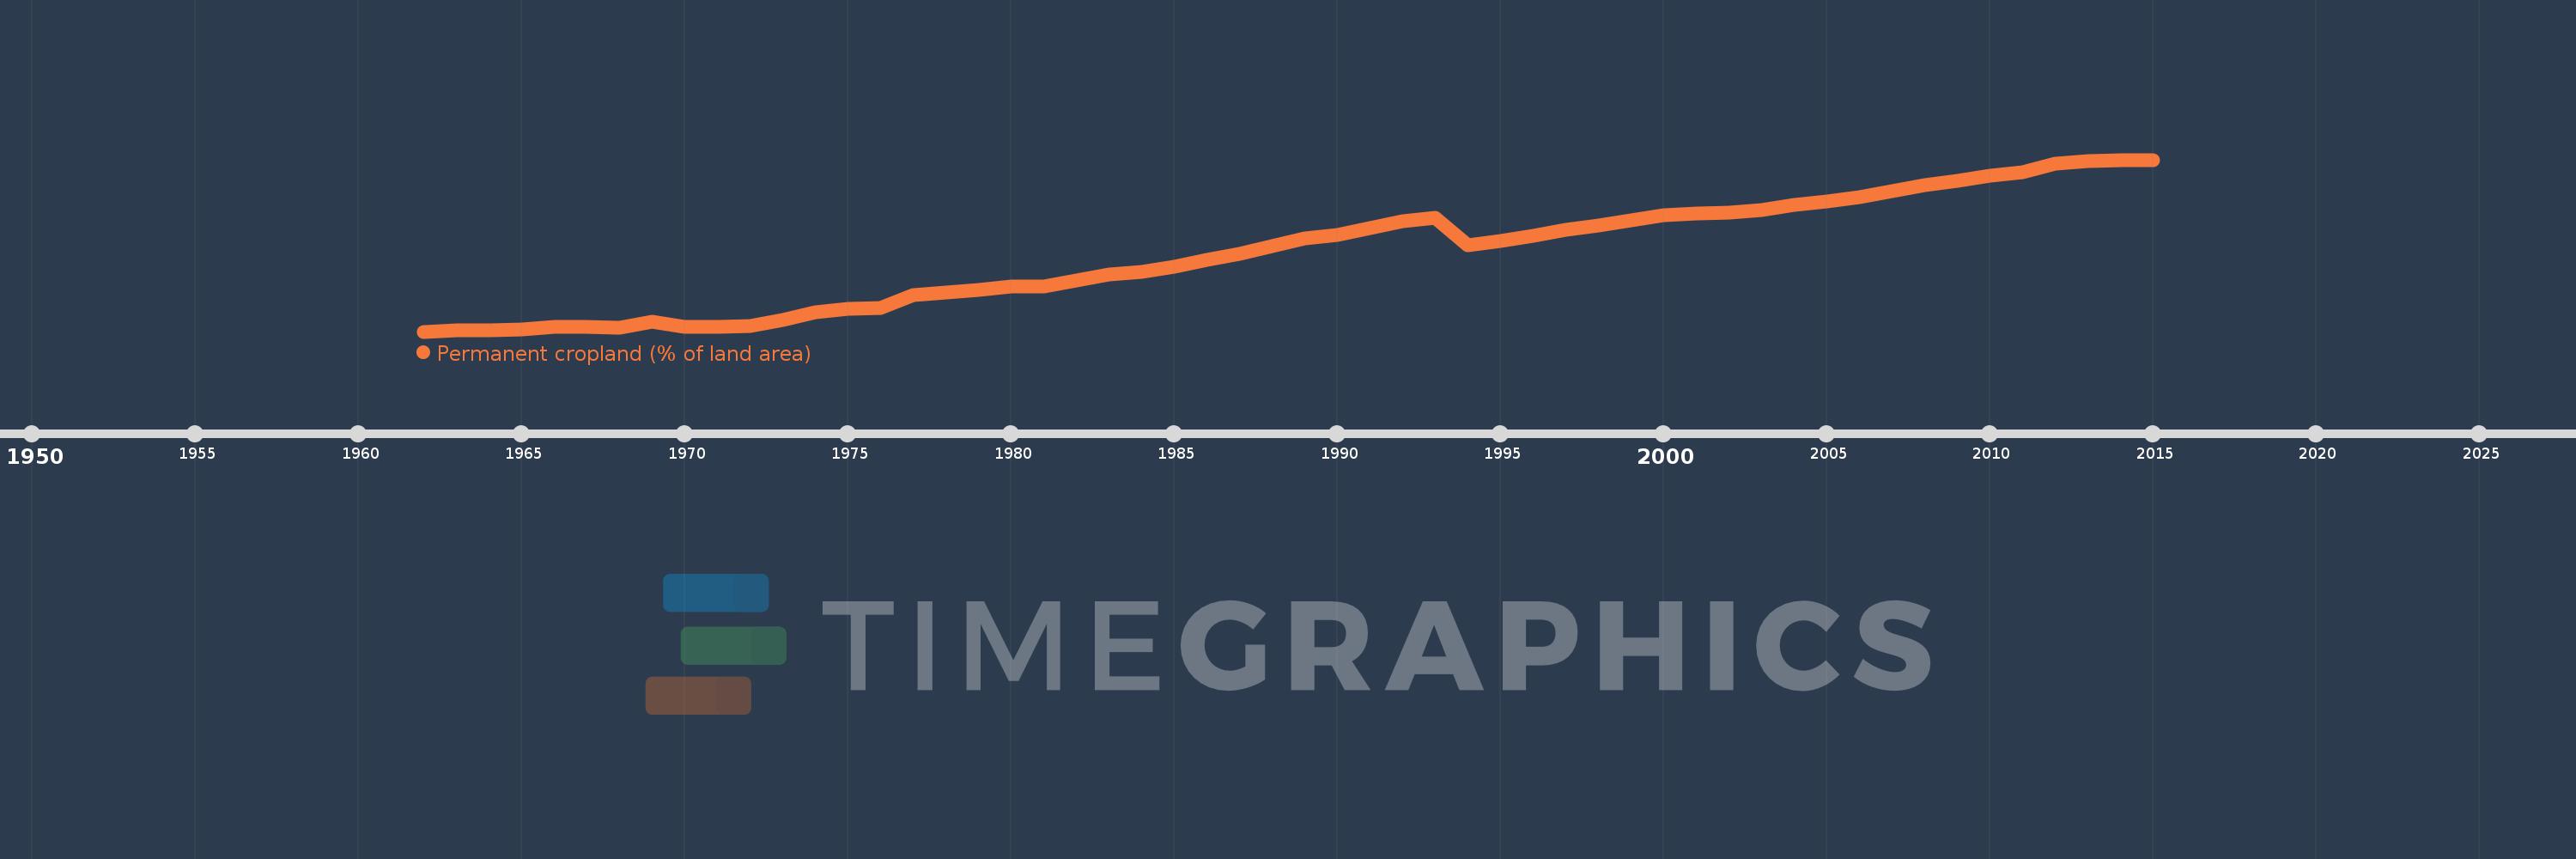
Permanent cropland (% of land area)
2015,2014,2013,2012,2011,2010,2009,2008,2007,2006,2005,2004,2003,2002,2001,2000,1999,1998,1997,1996,1995,1994,1993,1992,1991,1990,1989,1988,1987,1986,1985,1984,1983,1982,1981,1980,1979,1978,1977,1976,1975,1974,1973,1972,1971,1970,1969,1968,1967,1966,1965,1964,1963,1962
Estas estatísticas em outros países:
AfghanistanAlbaniaAlgeriaAmerican SamoaAngolaAntigua and BarbudaArab WorldArgentinaArmeniaAustraliaAustriaAzerbaijanBahamas, TheBahrainBangladeshBarbadosBelarusBelgiumBelizeBeninBhutanBoliviaBosnia and HerzegovinaBotswanaBrazilBritish Virgin IslandsBrunei DarussalamBulgariaBurkina FasoBurundiCabo VerdeCambodiaCameroonCanadaCaribbean small statesCayman IslandsCentral African RepublicCentral Europe and the BalticsChadChileChinaColombiaComorosCongo, Dem. Rep.Congo, Rep.Costa RicaCote d'IvoireCroatiaCubaCyprusCzech RepublicDenmarkDominicaDominican RepublicEarly-demographic dividendEast Asia & PacificEast Asia & Pacific (excluding high income)East Asia & Pacific (IDA & IBRD countries)EcuadorEgypt, Arab Rep.El SalvadorEquatorial GuineaEritreaEstoniaEthiopiaEuro areaEurope & Central AsiaEurope & Central Asia (excluding high income)Europe & Central Asia (IDA & IBRD countries)European UnionFijiFinlandFragile and conflict affected situationsFranceFrench PolynesiaGabonGambia, TheGeorgiaGermanyGhanaGreeceGrenadaGuamGuatemalaGuineaGuinea-BissauGuyanaHaitiHeavily indebted poor countries (HIPC)High incomeHondurasHong Kong SAR, ChinaHungaryIBRD onlyIDA & IBRD totalIDA blendIDA onlyIDA totalIndiaIndonesiaIran, Islamic Rep.IraqIrelandIsraelItalyJamaicaJapanJordanKazakhstanKenyaKiribatiKorea, Dem. People’s Rep.Korea, Rep.KuwaitKyrgyz RepublicLao PDRLate-demographic dividendLatin America & Caribbean Latin America & Caribbean (excluding high income)Latin America & the Caribbean (IDA & IBRD countries)LatviaLeast developed countries: UN classificationLebanonLesothoLiberiaLibyaLithuaniaLow & middle incomeLow incomeLower middle incomeLuxembourgMacedonia, FYRMadagascarMalawiMalaysiaMaldivesMaliMaltaMarshall IslandsMauritaniaMauritiusMexicoMicronesia, Fed. Sts.Middle East & North AfricaMiddle East & North Africa (excluding high income)Middle East & North Africa (IDA & IBRD countries)Middle incomeMoldovaMongoliaMontenegroMoroccoMozambiqueMyanmarNamibiaNauruNepalNetherlandsNew CaledoniaNew ZealandNicaraguaNigerNigeriaNorth AmericaNorthern Mariana IslandsNorwayOECD membersOmanOther small statesPacific island small statesPakistanPalauPanamaPapua New GuineaParaguayPeruPhilippinesPolandPortugalPost-demographic dividendPre-demographic dividendPuerto RicoQatarRomaniaRussian FederationRwandaSamoaSao Tome and PrincipeSaudi ArabiaSenegalSerbiaSeychellesSierra LeoneSingaporeSlovak RepublicSloveniaSmall statesSolomon IslandsSomaliaSouth AfricaSouth AsiaSouth Asia (IDA & IBRD)SpainSri LankaSt. Kitts and NevisSt. LuciaSt. Vincent and the GrenadinesSub-Saharan Africa Sub-Saharan Africa (excluding high income)Sub-Saharan Africa (IDA & IBRD countries)SudanSurinameSwazilandSwedenSwitzerlandSyrian Arab RepublicTajikistanTanzaniaThailandTimor-LesteTogoTongaTrinidad and TobagoTunisiaTurkeyTurkmenistanTuvaluUgandaUkraineUnited Arab EmiratesUnited KingdomUnited StatesUpper middle incomeUruguayUzbekistanVanuatuVenezuela, RBVietnamVirgin Islands (U.S.)West Bank and GazaWorldYemen, Rep.ZambiaZimbabwe Linha do tempo:
Nesta escala de tempo está apresentado um gráfico de 1962 ano até 2015 ano Syrian Arab Republic. Dados de 1961 ano ausente. O número de observações reais por data: 54.
Fonte (nome):
Indicadores de desenvolvimento mundial
Fonte (organização):
Food and Agriculture Organization, electronic files and web site.
Categorias:
Agriculture & Rural Development
Foi atualizado:
23 abr 2017 ano
Indicadores de alterações dos valores ao longo dos anos
Mínimo:
1.279
1 jan 1962 ano
Máximo:
5.832
1 jan 2014 ano
Na data de observação
Valor
Mudança absoluta
A alteração em relação ao valor anterior
1 jan 1962 ano
1.279
+1.279
0.0%
1 jan 1963 ano
1.306
+0.027
2.13%
1 jan 1964 ano
1.311
+0.005
0.42%
1 jan 1965 ano
1.328
+0.016
1.24%
1 jan 1966 ano
1.398
+0.071
5.33%
1 jan 1967 ano
1.398
0.0
0.0%
1 jan 1968 ano
1.382
-0.016
-1.17%
1 jan 1969 ano
1.545
+0.163
11.81%
1 jan 1970 ano
1.415
-0.131
-8.45%
1 jan 1971 ano
1.404
-0.011
-0.77%
1 jan 1972 ano
1.42
+0.016
1.16%
1 jan 1973 ano
1.578
+0.158
11.11%
1 jan 1974 ano
1.785
+0.207
13.1%
1 jan 1975 ano
1.877
+0.093
5.18%
1 jan 1976 ano
1.91
+0.033
1.74%
1 jan 1977 ano
2.242
+0.332
17.38%
1 jan 1978 ano
2.318
+0.076
3.4%
1 jan 1979 ano
2.389
+0.071
3.05%
1 jan 1980 ano
2.481
+0.093
3.87%
1 jan 1981 ano
2.47
-0.011
-0.44%
1 jan 1982 ano
2.634
+0.163
6.61%
1 jan 1983 ano
2.791
+0.158
5.99%
1 jan 1984 ano
2.857
+0.065
2.34%
1 jan 1985 ano
2.993
+0.136
4.76%
1 jan 1986 ano
3.183
+0.19
6.36%
1 jan 1987 ano
3.341
+0.158
4.96%
1 jan 1988 ano
3.537
+0.196
5.86%
1 jan 1989 ano
3.754
+0.218
6.15%
1 jan 1990 ano
3.836
+0.082
2.17%
1 jan 1991 ano
4.032
+0.196
5.11%
1 jan 1992 ano
4.201
+0.169
4.18%
1 jan 1993 ano
4.288
+0.087
2.07%
1 jan 1994 ano
3.564
-0.724
-16.88%
1 jan 1995 ano
3.673
+0.109
3.05%
1 jan 1996 ano
3.825
+0.152
4.15%
1 jan 1997 ano
3.978
+0.152
3.98%
1 jan 1998 ano
4.081
+0.103
2.6%
1 jan 1999 ano
4.217
+0.136
3.33%
1 jan 2000 ano
4.358
+0.141
3.35%
1 jan 2001 ano
4.407
+0.049
1.12%
1 jan 2002 ano
4.435
+0.027
0.62%
1 jan 2003 ano
4.505
+0.071
1.6%
1 jan 2004 ano
4.646
+0.141
3.13%
1 jan 2005 ano
4.734
+0.088
1.89%
1 jan 2006 ano
4.832
+0.098
2.07%
1 jan 2007 ano
4.994
+0.162
3.35%
1 jan 2008 ano
5.157
+0.163
3.27%
1 jan 2009 ano
5.266
+0.109
2.11%
1 jan 2010 ano
5.413
+0.147
2.79%
1 jan 2011 ano
5.495
+0.082
1.51%
1 jan 2012 ano
5.74
+0.245
4.46%
1 jan 2013 ano
5.805
+0.065
1.14%
1 jan 2014 ano
5.832
+0.027
0.47%
1 jan 2015 ano
5.832
0.0
0.0%
Classificação de países por estatísticas atuais por anos


Comentários: