29
/pt/
pt
AIzaSyAYiBZKx7MnpbEhh9jyipgxe19OcubqV5w
April 1, 2024
251188
St. Lucia
LCA
true
2
1
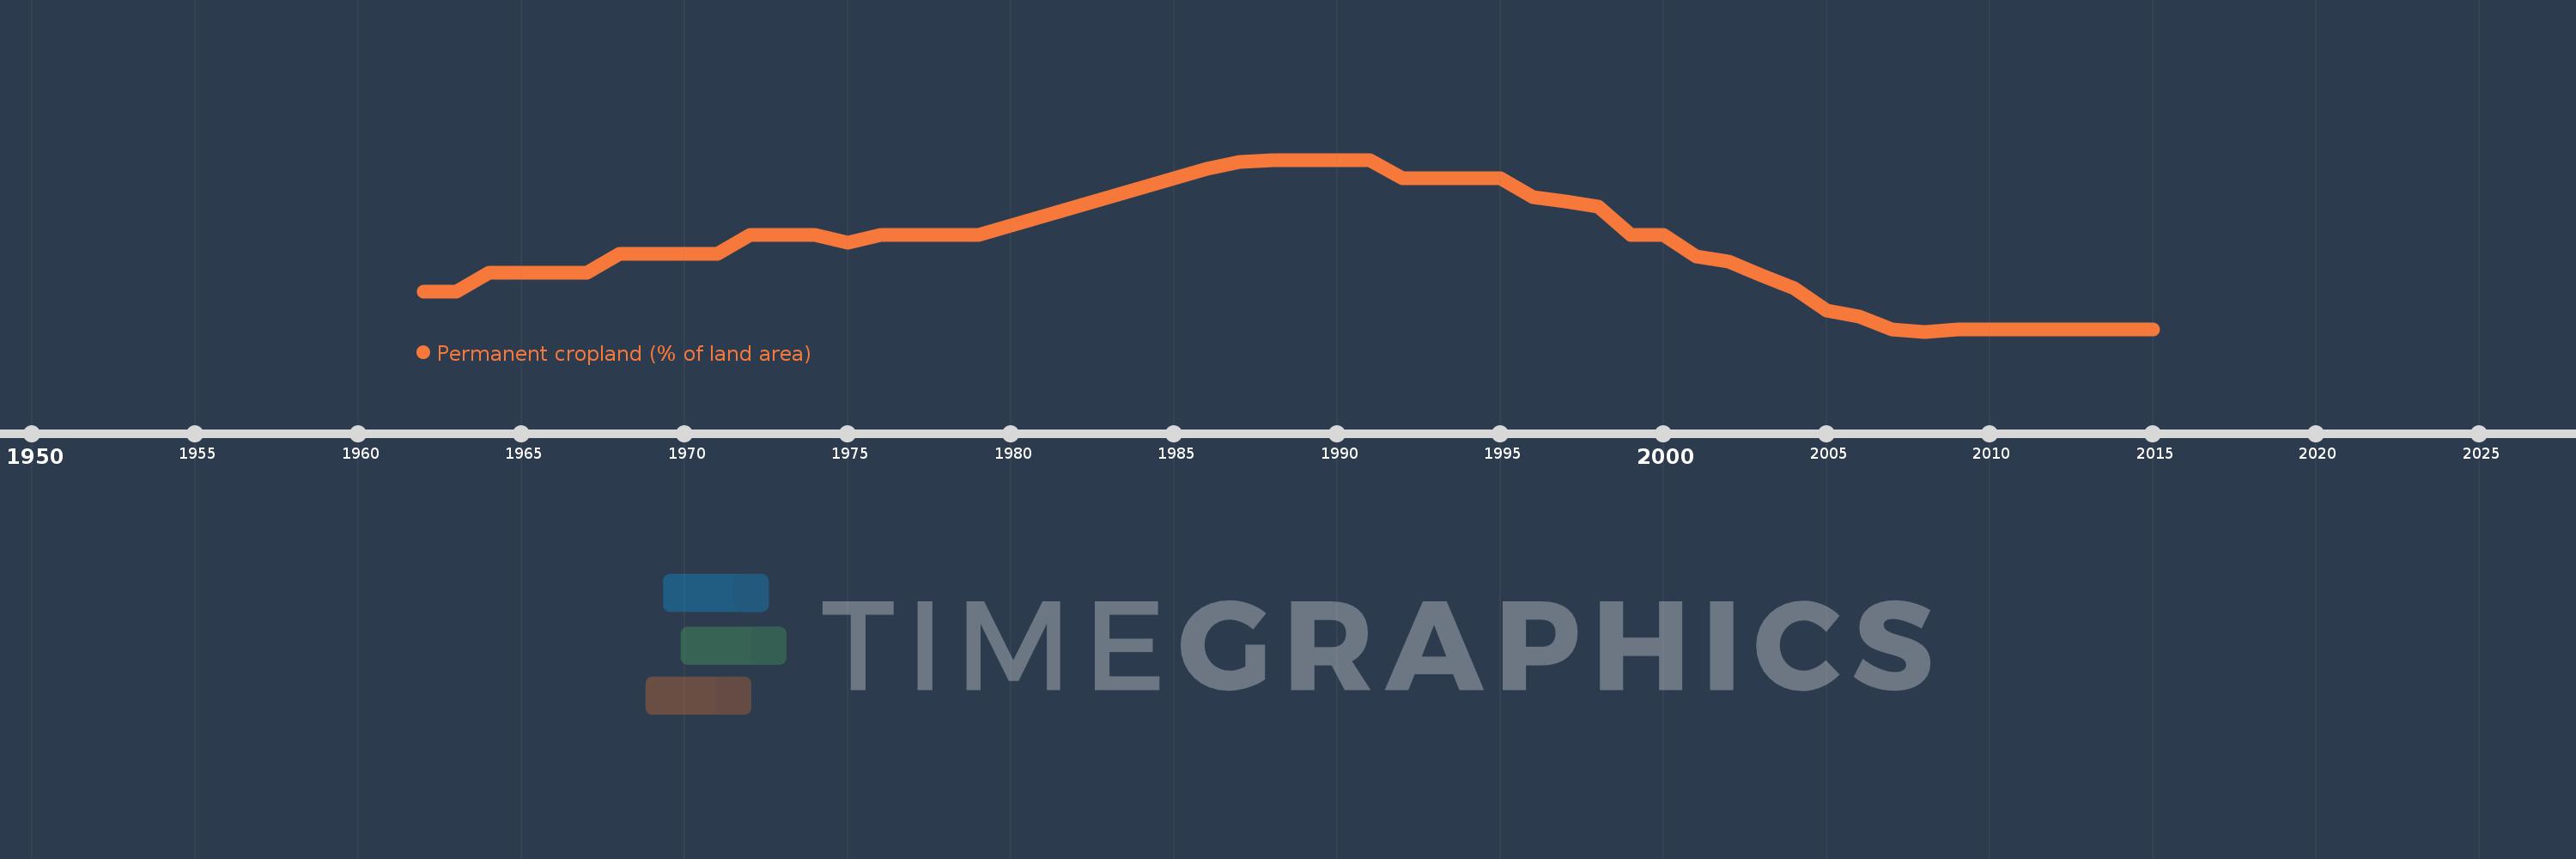
Permanent cropland (% of land area)
2015,2014,2013,2012,2011,2010,2009,2008,2007,2006,2005,2004,2003,2002,2001,2000,1999,1998,1997,1996,1995,1994,1993,1992,1991,1990,1989,1988,1987,1986,1985,1984,1983,1982,1981,1980,1979,1978,1977,1976,1975,1974,1973,1972,1971,1970,1969,1968,1967,1966,1965,1964,1963,1962
Estas estatísticas em outros países:
AfghanistanAlbaniaAlgeriaAmerican SamoaAngolaAntigua and BarbudaArab WorldArgentinaArmeniaAustraliaAustriaAzerbaijanBahamas, TheBahrainBangladeshBarbadosBelarusBelgiumBelizeBeninBhutanBoliviaBosnia and HerzegovinaBotswanaBrazilBritish Virgin IslandsBrunei DarussalamBulgariaBurkina FasoBurundiCabo VerdeCambodiaCameroonCanadaCaribbean small statesCayman IslandsCentral African RepublicCentral Europe and the BalticsChadChileChinaColombiaComorosCongo, Dem. Rep.Congo, Rep.Costa RicaCote d'IvoireCroatiaCubaCyprusCzech RepublicDenmarkDominicaDominican RepublicEarly-demographic dividendEast Asia & PacificEast Asia & Pacific (excluding high income)East Asia & Pacific (IDA & IBRD countries)EcuadorEgypt, Arab Rep.El SalvadorEquatorial GuineaEritreaEstoniaEthiopiaEuro areaEurope & Central AsiaEurope & Central Asia (excluding high income)Europe & Central Asia (IDA & IBRD countries)European UnionFijiFinlandFragile and conflict affected situationsFranceFrench PolynesiaGabonGambia, TheGeorgiaGermanyGhanaGreeceGrenadaGuamGuatemalaGuineaGuinea-BissauGuyanaHaitiHeavily indebted poor countries (HIPC)High incomeHondurasHong Kong SAR, ChinaHungaryIBRD onlyIDA & IBRD totalIDA blendIDA onlyIDA totalIndiaIndonesiaIran, Islamic Rep.IraqIrelandIsraelItalyJamaicaJapanJordanKazakhstanKenyaKiribatiKorea, Dem. People’s Rep.Korea, Rep.KuwaitKyrgyz RepublicLao PDRLate-demographic dividendLatin America & Caribbean Latin America & Caribbean (excluding high income)Latin America & the Caribbean (IDA & IBRD countries)LatviaLeast developed countries: UN classificationLebanonLesothoLiberiaLibyaLithuaniaLow & middle incomeLow incomeLower middle incomeLuxembourgMacedonia, FYRMadagascarMalawiMalaysiaMaldivesMaliMaltaMarshall IslandsMauritaniaMauritiusMexicoMicronesia, Fed. Sts.Middle East & North AfricaMiddle East & North Africa (excluding high income)Middle East & North Africa (IDA & IBRD countries)Middle incomeMoldovaMongoliaMontenegroMoroccoMozambiqueMyanmarNamibiaNauruNepalNetherlandsNew CaledoniaNew ZealandNicaraguaNigerNigeriaNorth AmericaNorthern Mariana IslandsNorwayOECD membersOmanOther small statesPacific island small statesPakistanPalauPanamaPapua New GuineaParaguayPeruPhilippinesPolandPortugalPost-demographic dividendPre-demographic dividendPuerto RicoQatarRomaniaRussian FederationRwandaSamoaSao Tome and PrincipeSaudi ArabiaSenegalSerbiaSeychellesSierra LeoneSingaporeSlovak RepublicSloveniaSmall statesSolomon IslandsSomaliaSouth AfricaSouth AsiaSouth Asia (IDA & IBRD)SpainSri LankaSt. Kitts and NevisSt. LuciaSt. Vincent and the GrenadinesSub-Saharan Africa Sub-Saharan Africa (excluding high income)Sub-Saharan Africa (IDA & IBRD countries)SudanSurinameSwazilandSwedenSwitzerlandSyrian Arab RepublicTajikistanTanzaniaThailandTimor-LesteTogoTongaTrinidad and TobagoTunisiaTurkeyTurkmenistanTuvaluUgandaUkraineUnited Arab EmiratesUnited KingdomUnited StatesUpper middle incomeUruguayUzbekistanVanuatuVenezuela, RBVietnamVirgin Islands (U.S.)West Bank and GazaWorldYemen, Rep.ZambiaZimbabwe Linha do tempo:
Nesta escala de tempo está apresentado um gráfico de 1962 ano até 2015 ano St. Lucia. Dados de 1961 ano ausente. O número de observações reais por data: 54.
Fonte (nome):
Indicadores de desenvolvimento mundial
Fonte (organização):
Food and Agriculture Organization, electronic files and web site.
Categorias:
Agriculture & Rural Development
Foi atualizado:
23 abr 2017 ano
Indicadores de alterações dos valores ao longo dos anos
Mínimo:
11.311
1 jan 2008 ano
Máximo:
26.23
1 jan 1988 ano
Na data de observação
Valor
Mudança absoluta
A alteração em relação ao valor anterior
1 jan 1962 ano
14.754
+14.754
0.0%
1 jan 1963 ano
14.754
0.0
0.0%
1 jan 1964 ano
16.393
+1.639
11.11%
1 jan 1965 ano
16.393
0.0
0.0%
1 jan 1966 ano
16.393
0.0
0.0%
1 jan 1967 ano
16.393
0.0
0.0%
1 jan 1968 ano
18.033
+1.639
10.0%
1 jan 1969 ano
18.033
0.0
0.0%
1 jan 1970 ano
18.033
0.0
0.0%
1 jan 1971 ano
18.033
0.0
0.0%
1 jan 1972 ano
19.672
+1.639
9.09%
1 jan 1973 ano
19.672
0.0
0.0%
1 jan 1974 ano
19.672
0.0
0.0%
1 jan 1975 ano
19.016
-0.656
-3.33%
1 jan 1976 ano
19.672
+0.656
3.45%
1 jan 1977 ano
19.672
0.0
0.0%
1 jan 1978 ano
19.672
0.0
0.0%
1 jan 1979 ano
19.672
0.0
0.0%
1 jan 1980 ano
20.492
+0.82
4.17%
1 jan 1981 ano
21.311
+0.82
4.0%
1 jan 1982 ano
22.131
+0.82
3.85%
1 jan 1983 ano
22.951
+0.82
3.7%
1 jan 1984 ano
23.77
+0.82
3.57%
1 jan 1985 ano
24.59
+0.82
3.45%
1 jan 1986 ano
25.41
+0.82
3.33%
1 jan 1987 ano
26.066
+0.656
2.58%
1 jan 1988 ano
26.23
+0.164
0.63%
1 jan 1989 ano
26.23
0.0
0.0%
1 jan 1990 ano
26.23
0.0
0.0%
1 jan 1991 ano
26.23
0.0
0.0%
1 jan 1992 ano
24.59
-1.639
-6.25%
1 jan 1993 ano
24.59
0.0
0.0%
1 jan 1994 ano
24.59
0.0
0.0%
1 jan 1995 ano
24.59
0.0
0.0%
1 jan 1996 ano
22.951
-1.639
-6.67%
1 jan 1997 ano
22.623
-0.328
-1.43%
1 jan 1998 ano
22.131
-0.492
-2.17%
1 jan 1999 ano
19.672
-2.459
-11.11%
1 jan 2000 ano
19.672
0.0
0.0%
1 jan 2001 ano
17.869
-1.803
-9.17%
1 jan 2002 ano
17.377
-0.492
-2.75%
1 jan 2003 ano
16.23
-1.148
-6.6%
1 jan 2004 ano
15.082
-1.148
-7.07%
1 jan 2005 ano
13.115
-1.967
-13.04%
1 jan 2006 ano
12.623
-0.492
-3.75%
1 jan 2007 ano
11.475
-1.148
-9.09%
1 jan 2008 ano
11.311
-0.164
-1.43%
1 jan 2009 ano
11.475
+0.164
1.45%
1 jan 2010 ano
11.475
0.0
0.0%
1 jan 2011 ano
11.475
0.0
0.0%
1 jan 2012 ano
11.475
0.0
0.0%
1 jan 2013 ano
11.475
0.0
0.0%
1 jan 2014 ano
11.475
0.0
0.0%
1 jan 2015 ano
11.475
0.0
0.0%
Classificação de países por estatísticas atuais por anos


Comentários: