29
/pt/
pt
AIzaSyAYiBZKx7MnpbEhh9jyipgxe19OcubqV5w
April 1, 2024
25839
Central Europe and the Baltics
CEB
false
2
1
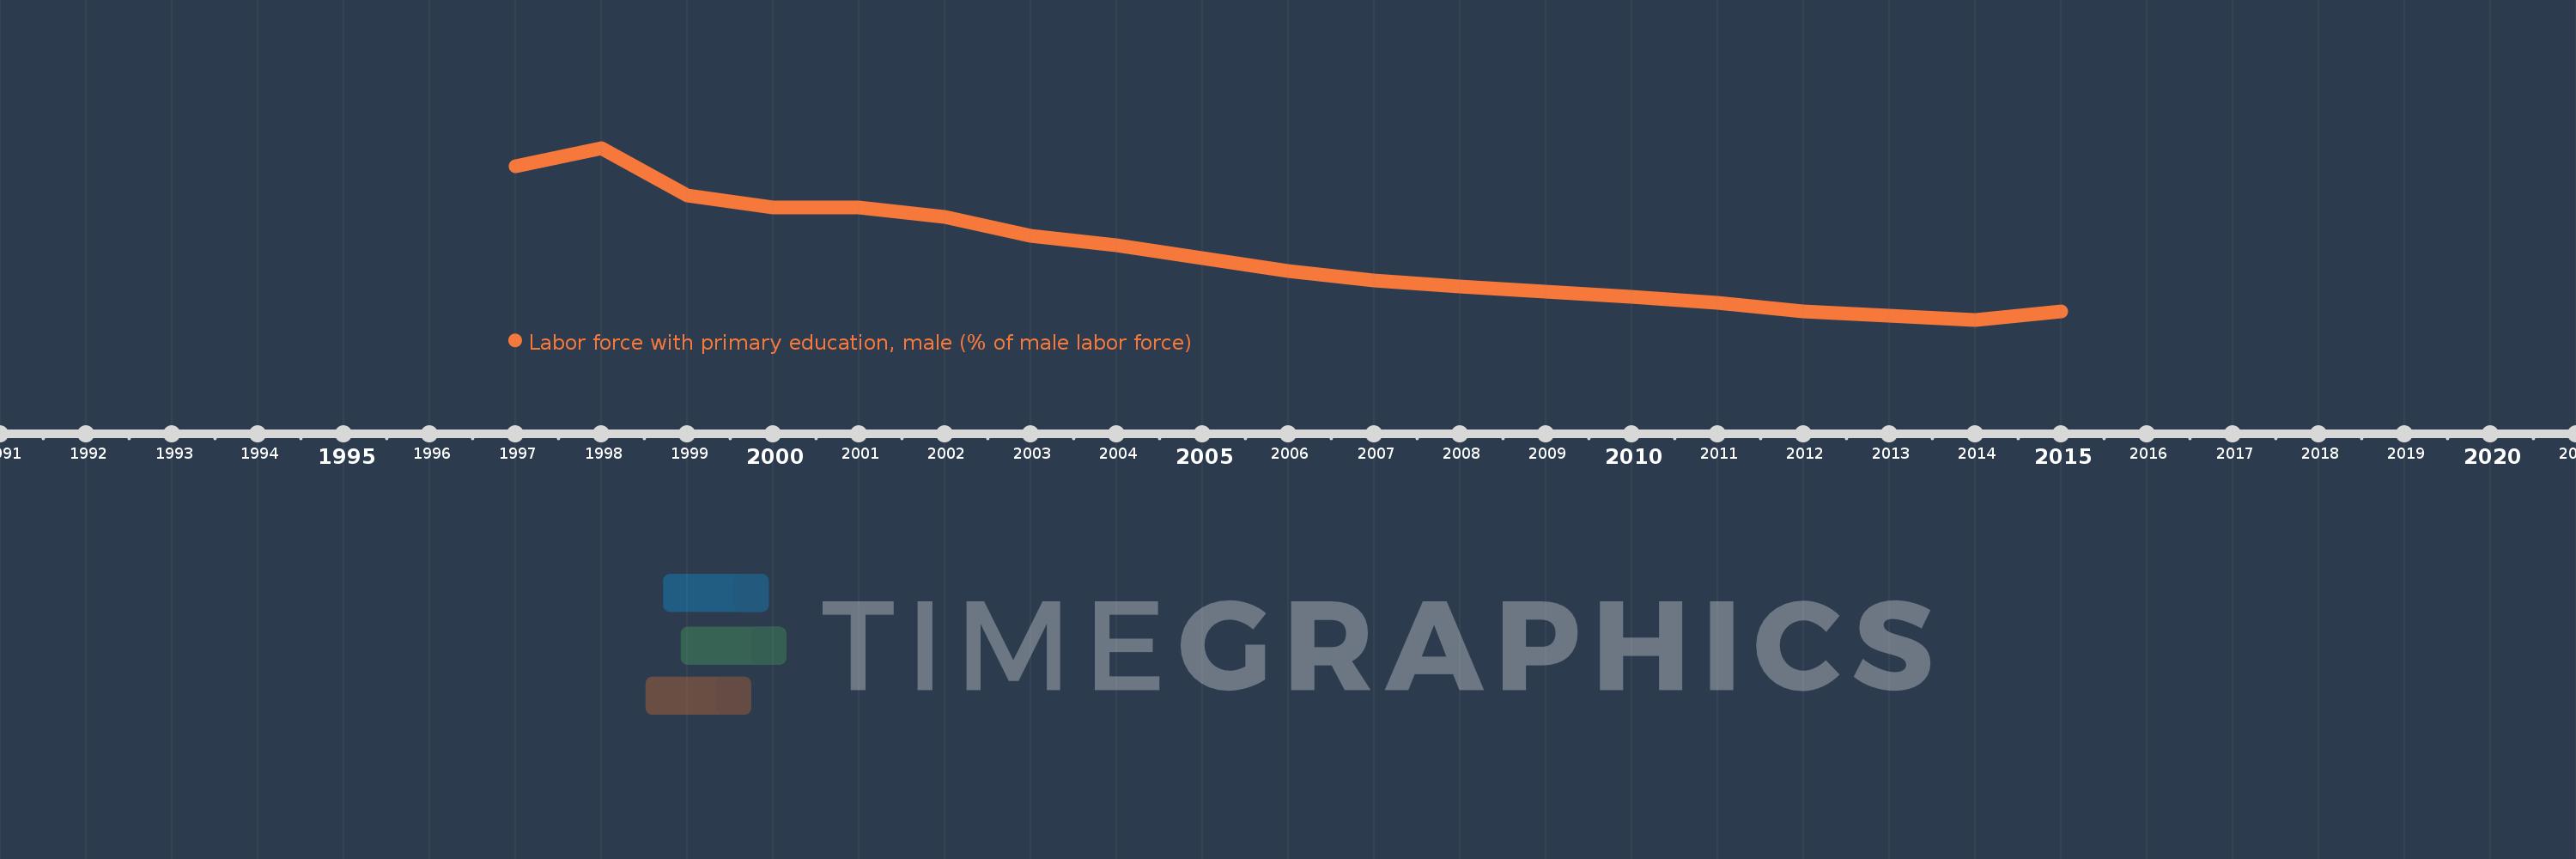
Labor force with primary education, male (% of male labor force)
2015,2014,2013,2012,2011,2010,2009,2008,2007,2006,2005,2004,2003,2002,2001,2000,1999,1998,1997
Estas estatísticas em outros países:
Linha do tempo:
Nesta escala de tempo está apresentado um gráfico de 1997 ano até 2015 ano Central Europe and the Baltics. Dados de 1996 ano ausente. O número de observações reais por data: 19.
Fonte (nome):
Indicadores de desenvolvimento mundial
Fonte (organização):
International Labour Organization, Key Indicators of the Labour Market database.
Categorias:
Education, Social Protection & Labor, Gender
Foi atualizado:
23 abr 2017 ano
Indicadores de alterações dos valores ao longo dos anos
Mínimo:
11.212
1 jan 2014 ano
Máximo:
23.439
1 jan 1998 ano
Na data de observação
Valor
Mudança absoluta
A alteração em relação ao valor anterior
1 jan 1997 ano
22.147
+22.147
0.0%
1 jan 1998 ano
23.439
+1.291
5.83%
1 jan 1999 ano
20.032
-3.406
-14.53%
1 jan 2000 ano
19.222
-0.81
-4.05%
1 jan 2001 ano
19.214
-0.008
-0.04%
1 jan 2002 ano
18.539
-0.675
-3.51%
1 jan 2003 ano
17.19
-1.349
-7.28%
1 jan 2004 ano
16.541
-0.648
-3.77%
1 jan 2005 ano
15.577
-0.964
-5.83%
1 jan 2006 ano
14.673
-0.904
-5.81%
1 jan 2007 ano
13.993
-0.679
-4.63%
1 jan 2008 ano
13.566
-0.428
-3.06%
1 jan 2009 ano
13.216
-0.349
-2.57%
1 jan 2010 ano
12.822
-0.394
-2.98%
1 jan 2011 ano
12.408
-0.414
-3.23%
1 jan 2012 ano
11.804
-0.605
-4.87%
1 jan 2013 ano
11.5
-0.304
-2.58%
1 jan 2014 ano
11.212
-0.287
-2.5%
1 jan 2015 ano
11.785
+0.573
5.11%
Classificação de países por estatísticas atuais por anos


Comentários: