29
/pt/
pt
AIzaSyAYiBZKx7MnpbEhh9jyipgxe19OcubqV5w
April 1, 2024
228697
Romania
ROU
true
2
1
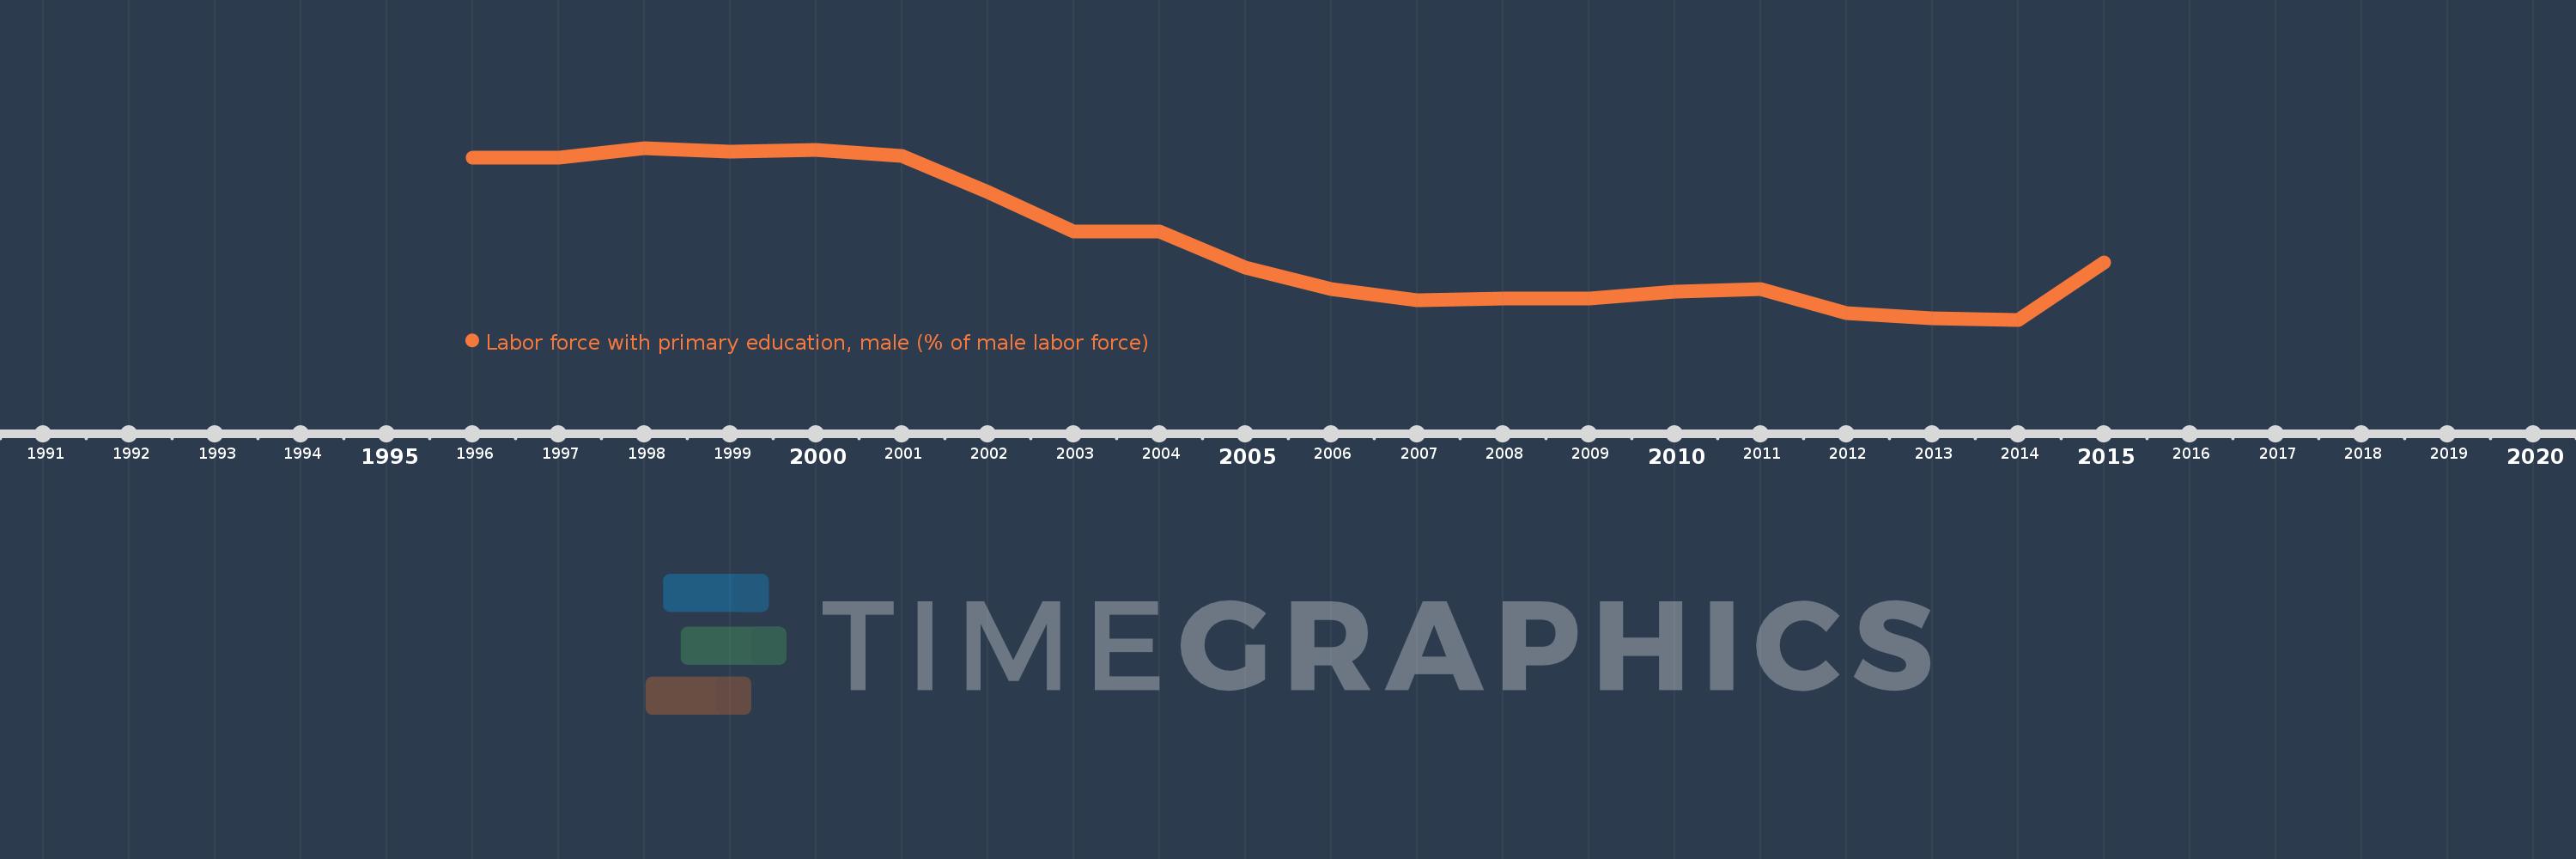
Labor force with primary education, male (% of male labor force)
2015,2014,2013,2012,2011,2010,2009,2008,2007,2006,2005,2004,2003,2002,2001,2000,1999,1998,1997,1996
Estas estatísticas em outros países:
Linha do tempo:
Nesta escala de tempo está apresentado um gráfico de 1996 ano até 2015 ano Romania. Dados de 1995 ano ausente. O número de observações reais por data: 20.
Fonte (nome):
Indicadores de desenvolvimento mundial
Fonte (organização):
International Labour Organization, Key Indicators of the Labour Market database.
Categorias:
Education, Social Protection & Labor, Gender
Foi atualizado:
23 abr 2017 ano
Indicadores de alterações dos valores ao longo dos anos
Mínimo:
21.1
1 jan 2014 ano
Máximo:
31.6
1 jan 1998 ano
Na data de observação
Valor
Mudança absoluta
A alteração em relação ao valor anterior
1 jan 1996 ano
31.0
+31.0
0.0%
1 jan 1997 ano
31.0
0.0
0.0%
1 jan 1998 ano
31.6
+0.6
1.94%
1 jan 1999 ano
31.4
-0.2
-0.63%
1 jan 2000 ano
31.5
+0.1
0.32%
1 jan 2001 ano
31.1
-0.4
-1.27%
1 jan 2002 ano
28.9
-2.2
-7.07%
1 jan 2003 ano
26.5
-2.4
-8.3%
1 jan 2004 ano
26.5
0.0
0.0%
1 jan 2005 ano
24.3
-2.2
-8.3%
1 jan 2006 ano
23.0
-1.3
-5.35%
1 jan 2007 ano
22.3
-0.7
-3.04%
1 jan 2008 ano
22.4
+0.1
0.45%
1 jan 2009 ano
22.4
0.0
0.0%
1 jan 2010 ano
22.8
+0.4
1.79%
1 jan 2011 ano
23.0
+0.2
0.88%
1 jan 2012 ano
21.5
-1.5
-6.52%
1 jan 2013 ano
21.2
-0.3
-1.4%
1 jan 2014 ano
21.1
-0.1
-0.47%
1 jan 2015 ano
24.6
+3.5
16.59%
Classificação de países por estatísticas atuais por anos


Comentários: