29
/pt/
pt
AIzaSyAYiBZKx7MnpbEhh9jyipgxe19OcubqV5w
April 1, 2024
257454
Switzerland
CHE
true
2
1
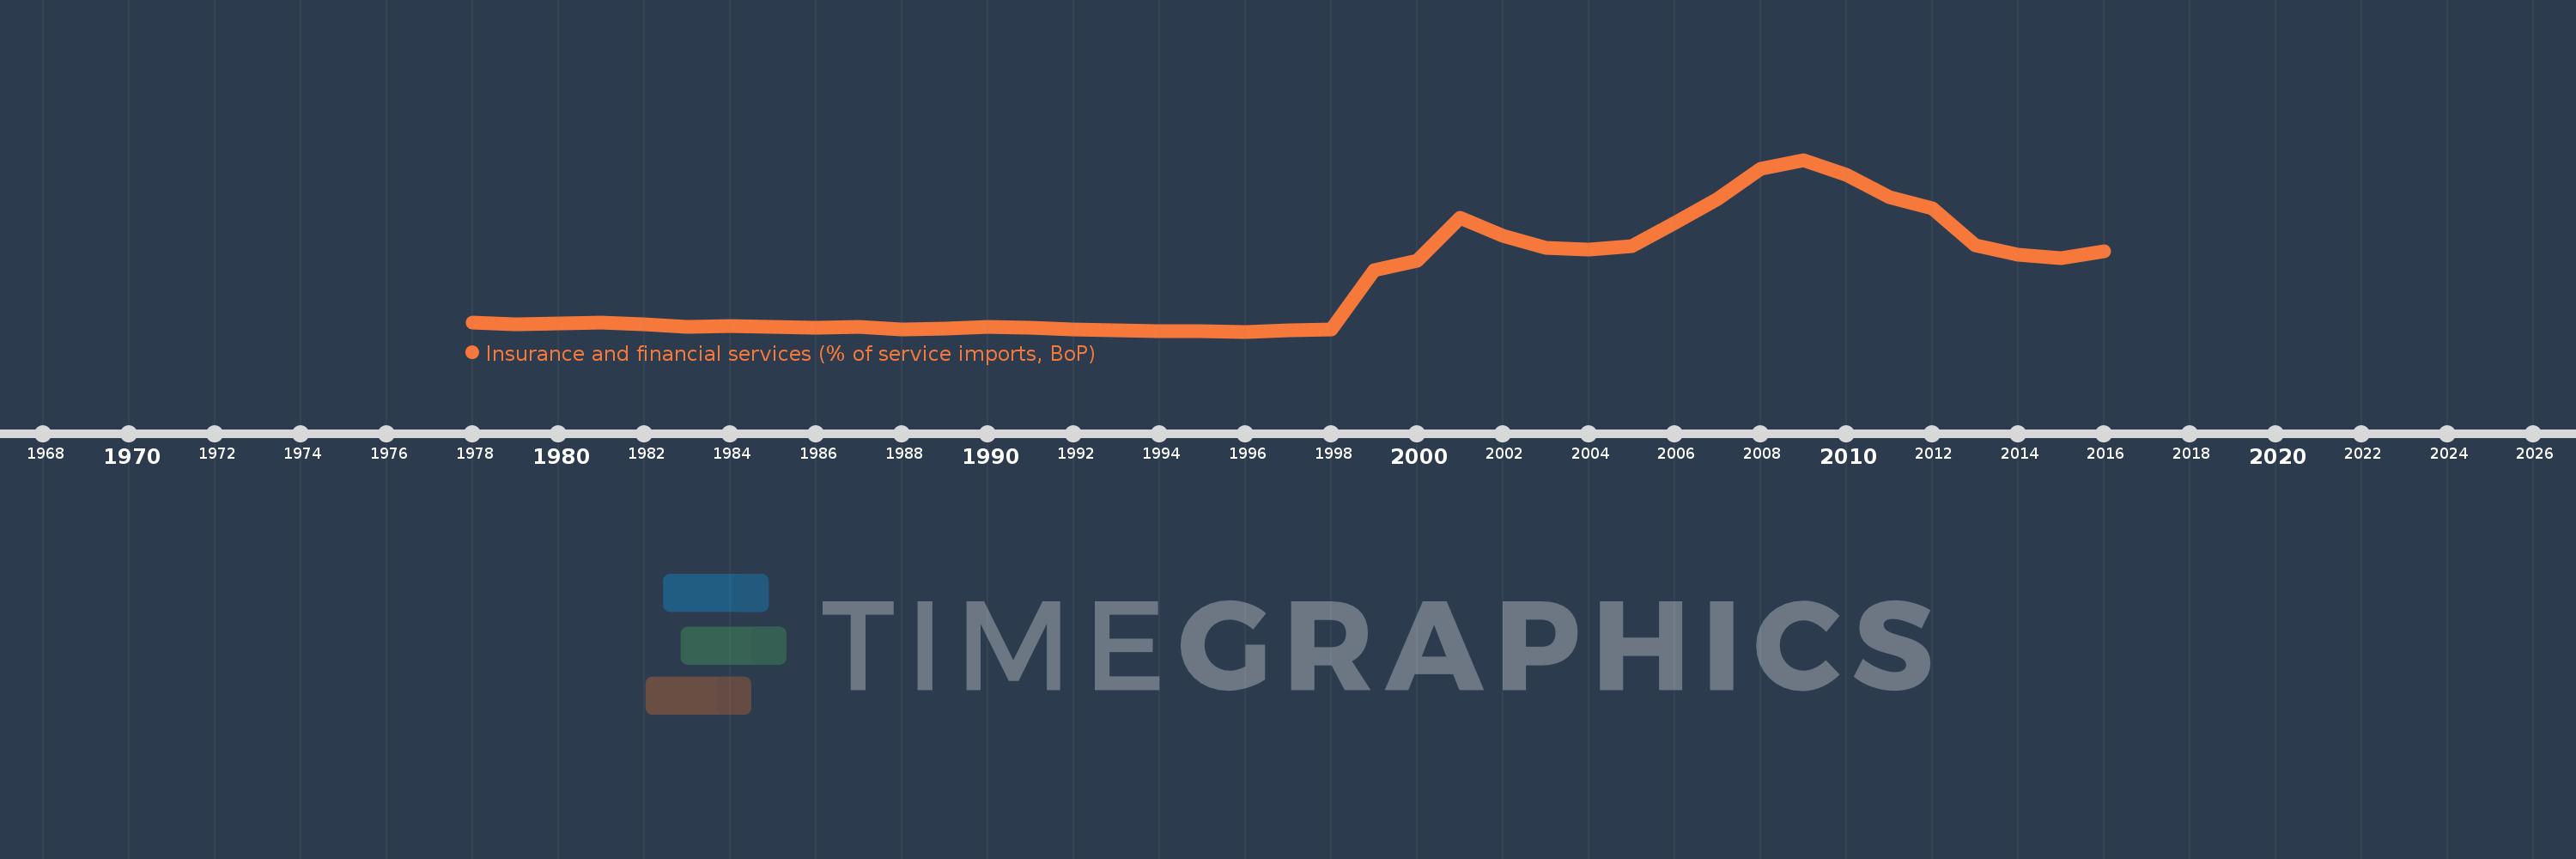
Insurance and financial services (% of service imports, BoP)
2016,2015,2014,2013,2012,2011,2010,2009,2008,2007,2006,2005,2004,2003,2002,2001,2000,1999,1998,1997,1996,1995,1994,1993,1992,1991,1990,1989,1988,1987,1986,1985,1984,1983,1982,1981,1980,1979,1978
Estas estatísticas em outros países:
AfghanistanAlbaniaAlgeriaAngolaAntigua and BarbudaArab WorldArgentinaArmeniaArubaAustraliaAustriaAzerbaijanBahamas, TheBahrainBangladeshBarbadosBelarusBelgiumBelizeBeninBermudaBhutanBoliviaBosnia and HerzegovinaBotswanaBrazilBrunei DarussalamBulgariaBurkina FasoBurundiCabo VerdeCambodiaCameroonCanadaCaribbean small statesCentral African RepublicCentral Europe and the BalticsChadChileChinaColombiaComorosCongo, Dem. Rep.Congo, Rep.Costa RicaCote d'IvoireCroatiaCuracaoCyprusCzech RepublicDenmarkDjiboutiDominicaDominican RepublicEarly-demographic dividendEast Asia & PacificEast Asia & Pacific (excluding high income)East Asia & Pacific (IDA & IBRD countries)EcuadorEgypt, Arab Rep.El SalvadorEquatorial GuineaEritreaEstoniaEthiopiaEuro areaEurope & Central AsiaEurope & Central Asia (excluding high income)Europe & Central Asia (IDA & IBRD countries)European UnionFaroe IslandsFijiFinlandFragile and conflict affected situationsFranceFrench PolynesiaGabonGambia, TheGeorgiaGermanyGhanaGreeceGrenadaGuatemalaGuineaGuinea-BissauGuyanaHaitiHeavily indebted poor countries (HIPC)High incomeHondurasHong Kong SAR, ChinaHungaryIBRD onlyIcelandIDA & IBRD totalIDA onlyIDA totalIndiaIndonesiaIran, Islamic Rep.IraqIrelandIsraelItalyJamaicaJapanJordanKazakhstanKenyaKiribatiKorea, Rep.KosovoKuwaitKyrgyz RepublicLao PDRLate-demographic dividendLatin America & Caribbean Latin America & Caribbean (excluding high income)Latin America & the Caribbean (IDA & IBRD countries)LatviaLeast developed countries: UN classificationLebanonLesothoLiberiaLibyaLithuaniaLow & middle incomeLow incomeLower middle incomeLuxembourgMacao SAR, ChinaMacedonia, FYRMadagascarMalawiMalaysiaMaldivesMaliMaltaMarshall IslandsMauritaniaMauritiusMexicoMicronesia, Fed. Sts.Middle East & North AfricaMiddle East & North Africa (excluding high income)Middle East & North Africa (IDA & IBRD countries)Middle incomeMoldovaMongoliaMontenegroMoroccoMozambiqueMyanmarNamibiaNepalNetherlandsNew CaledoniaNew ZealandNicaraguaNigerNigeriaNorth AmericaNorwayOECD membersOmanOther small statesPacific island small statesPakistanPalauPanamaPapua New GuineaParaguayPeruPhilippinesPolandPortugalPost-demographic dividendPre-demographic dividendQatarRomaniaRussian FederationRwandaSamoaSao Tome and PrincipeSaudi ArabiaSenegalSerbiaSeychellesSierra LeoneSingaporeSint Maarten (Dutch part)Slovak RepublicSloveniaSmall statesSolomon IslandsSouth AfricaSouth AsiaSouth Asia (IDA & IBRD)South SudanSpainSri LankaSt. Kitts and NevisSt. LuciaSt. Vincent and the GrenadinesSub-Saharan Africa Sub-Saharan Africa (excluding high income)Sub-Saharan Africa (IDA & IBRD countries)SudanSurinameSwazilandSwedenSwitzerlandSyrian Arab RepublicTajikistanTanzaniaThailandTimor-LesteTogoTongaTrinidad and TobagoTunisiaTurkeyTuvaluUgandaUkraineUnited KingdomUnited StatesUpper middle incomeUruguayVanuatuVenezuela, RBWest Bank and GazaWorldYemen, Rep.ZambiaZimbabwe Linha do tempo:
Nesta escala de tempo está apresentado um gráfico de 1978 ano até 2016 ano Switzerland. Dados de 1977 ano ausente. O número de observações reais por data: 39.
Fonte (nome):
Indicadores de desenvolvimento mundial
Fonte (organização):
International Monetary Fund, Balance of Payments Statistics Yearbook and data files.
Categorias:
Economy & Growth, Private Sector, Trade
Foi atualizado:
23 abr 2017 ano
Indicadores de alterações dos valores ao longo dos anos
Mínimo:
1.096
1 jan 1996 ano
Máximo:
11.244
1 jan 2009 ano
Na data de observação
Valor
Mudança absoluta
A alteração em relação ao valor anterior
1 jan 1978 ano
1.639
+1.639
0.0%
1 jan 1979 ano
1.523
-0.116
-7.06%
1 jan 1980 ano
1.555
+0.032
2.1%
1 jan 1981 ano
1.609
+0.053
3.43%
1 jan 1982 ano
1.507
-0.101
-6.29%
1 jan 1983 ano
1.388
-0.12
-7.93%
1 jan 1984 ano
1.421
+0.033
2.41%
1 jan 1985 ano
1.382
-0.039
-2.76%
1 jan 1986 ano
1.32
-0.063
-4.53%
1 jan 1987 ano
1.35
+0.031
2.31%
1 jan 1988 ano
1.229
-0.121
-8.95%
1 jan 1989 ano
1.274
+0.045
3.63%
1 jan 1990 ano
1.35
+0.076
5.98%
1 jan 1991 ano
1.343
-0.007
-0.5%
1 jan 1992 ano
1.243
-0.1
-7.45%
1 jan 1993 ano
1.167
-0.076
-6.11%
1 jan 1994 ano
1.131
-0.037
-3.15%
1 jan 1995 ano
1.099
-0.032
-2.8%
1 jan 1996 ano
1.096
-0.003
-0.28%
1 jan 1997 ano
1.166
+0.07
6.41%
1 jan 1998 ano
1.241
+0.075
6.43%
1 jan 1999 ano
4.749
+3.508
282.68%
1 jan 2000 ano
5.266
+0.517
10.89%
1 jan 2001 ano
7.827
+2.561
48.62%
1 jan 2002 ano
6.729
-1.098
-14.03%
1 jan 2003 ano
6.044
-0.684
-10.17%
1 jan 2004 ano
5.934
-0.11
-1.82%
1 jan 2005 ano
6.135
+0.201
3.38%
1 jan 2006 ano
7.537
+1.401
22.84%
1 jan 2007 ano
8.942
+1.405
18.65%
1 jan 2008 ano
10.711
+1.769
19.79%
1 jan 2009 ano
11.244
+0.533
4.98%
1 jan 2010 ano
10.351
-0.893
-7.94%
1 jan 2011 ano
9.051
-1.3
-12.56%
1 jan 2012 ano
8.388
-0.664
-7.33%
1 jan 2013 ano
6.198
-2.19
-26.11%
1 jan 2014 ano
5.651
-0.547
-8.82%
1 jan 2015 ano
5.417
-0.234
-4.14%
1 jan 2016 ano
5.835
+0.418
7.71%
Classificação de países por estatísticas atuais por anos


Comentários: