29
/pt/
pt
AIzaSyAYiBZKx7MnpbEhh9jyipgxe19OcubqV5w
April 1, 2024
252022
St. Vincent and the Grenadines
VCT
true
2
1
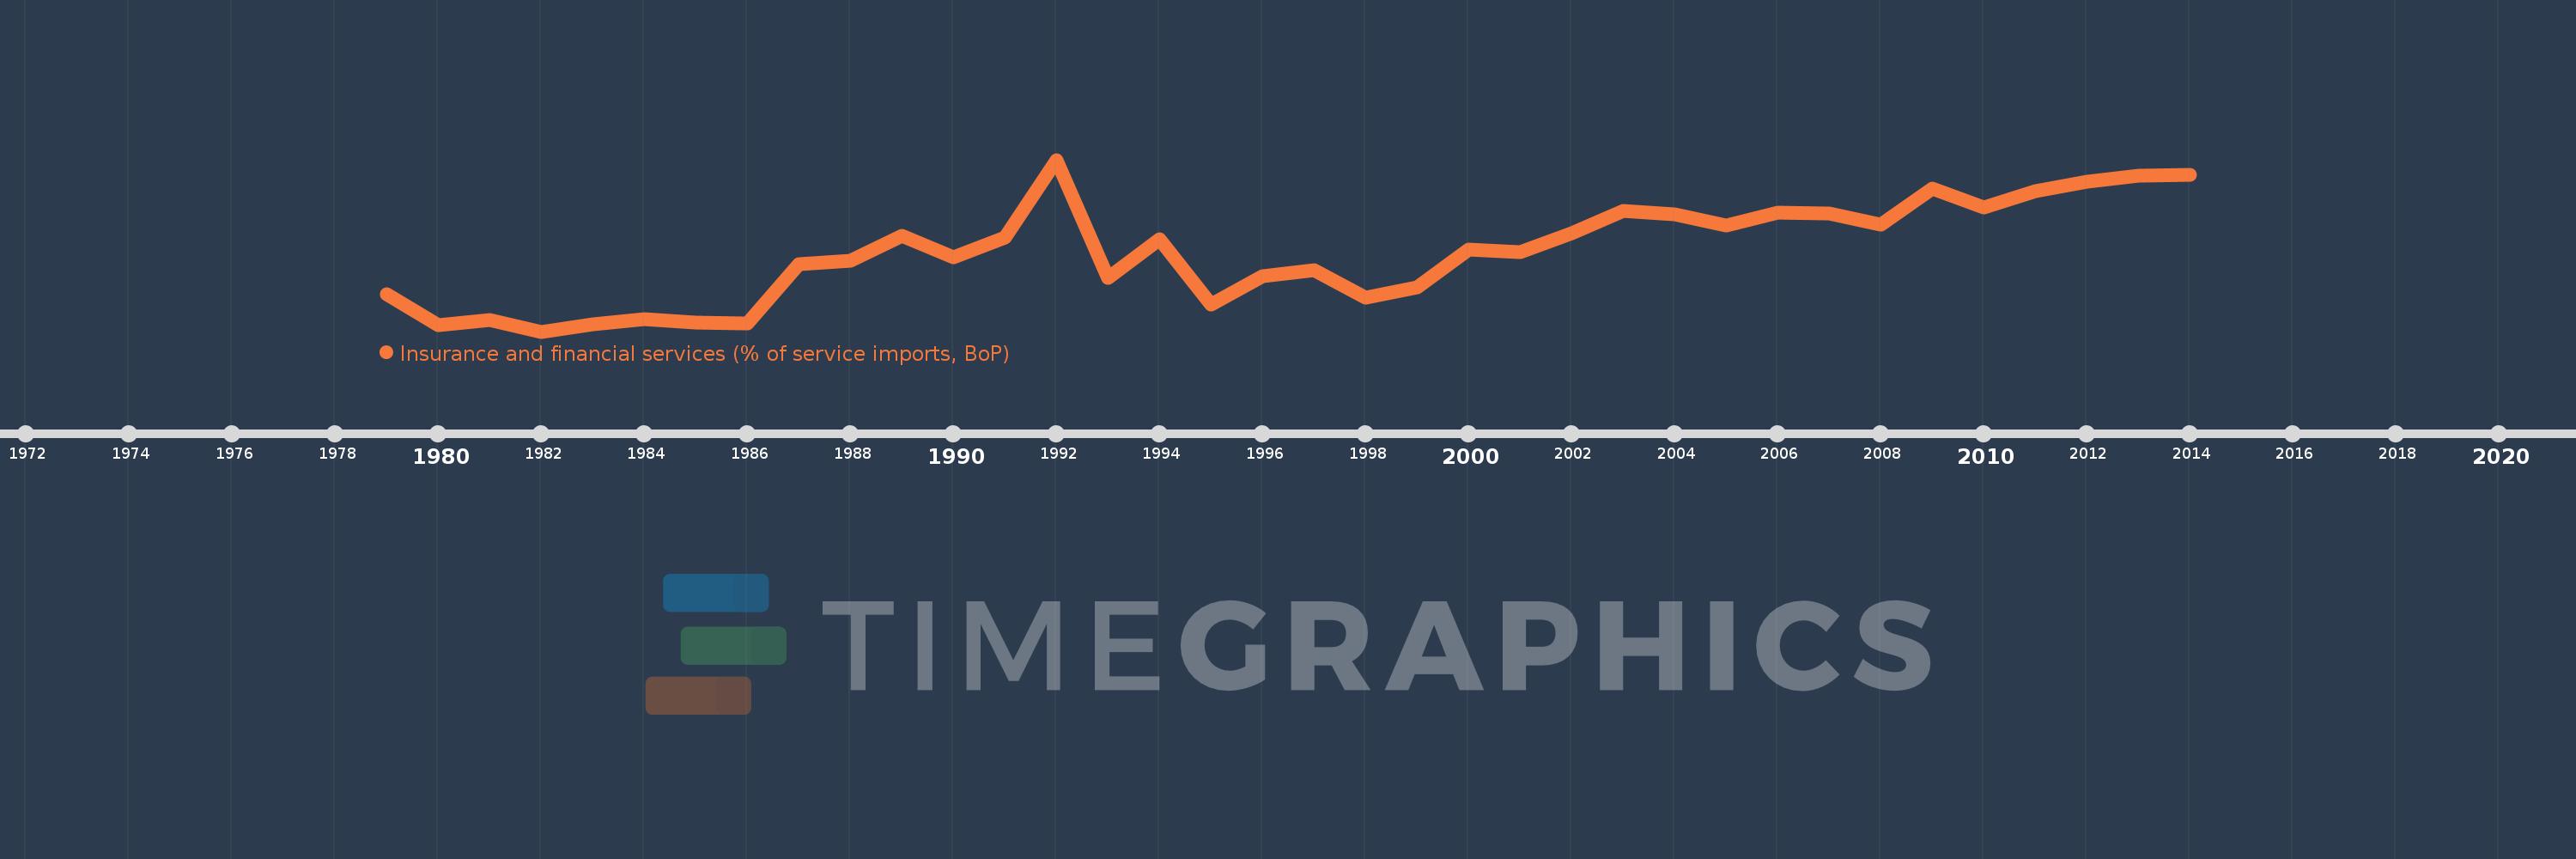
Insurance and financial services (% of service imports, BoP)
2014,2013,2012,2011,2010,2009,2008,2007,2006,2005,2004,2003,2002,2001,2000,1999,1998,1997,1996,1995,1994,1993,1992,1991,1990,1989,1988,1987,1986,1985,1984,1983,1982,1981,1980,1979
Estas estatísticas em outros países:
AfghanistanAlbaniaAlgeriaAngolaAntigua and BarbudaArab WorldArgentinaArmeniaArubaAustraliaAustriaAzerbaijanBahamas, TheBahrainBangladeshBarbadosBelarusBelgiumBelizeBeninBermudaBhutanBoliviaBosnia and HerzegovinaBotswanaBrazilBrunei DarussalamBulgariaBurkina FasoBurundiCabo VerdeCambodiaCameroonCanadaCaribbean small statesCentral African RepublicCentral Europe and the BalticsChadChileChinaColombiaComorosCongo, Dem. Rep.Congo, Rep.Costa RicaCote d'IvoireCroatiaCuracaoCyprusCzech RepublicDenmarkDjiboutiDominicaDominican RepublicEarly-demographic dividendEast Asia & PacificEast Asia & Pacific (excluding high income)East Asia & Pacific (IDA & IBRD countries)EcuadorEgypt, Arab Rep.El SalvadorEquatorial GuineaEritreaEstoniaEthiopiaEuro areaEurope & Central AsiaEurope & Central Asia (excluding high income)Europe & Central Asia (IDA & IBRD countries)European UnionFaroe IslandsFijiFinlandFragile and conflict affected situationsFranceFrench PolynesiaGabonGambia, TheGeorgiaGermanyGhanaGreeceGrenadaGuatemalaGuineaGuinea-BissauGuyanaHaitiHeavily indebted poor countries (HIPC)High incomeHondurasHong Kong SAR, ChinaHungaryIBRD onlyIcelandIDA & IBRD totalIDA onlyIDA totalIndiaIndonesiaIran, Islamic Rep.IraqIrelandIsraelItalyJamaicaJapanJordanKazakhstanKenyaKiribatiKorea, Rep.KosovoKuwaitKyrgyz RepublicLao PDRLate-demographic dividendLatin America & Caribbean Latin America & Caribbean (excluding high income)Latin America & the Caribbean (IDA & IBRD countries)LatviaLeast developed countries: UN classificationLebanonLesothoLiberiaLibyaLithuaniaLow & middle incomeLow incomeLower middle incomeLuxembourgMacao SAR, ChinaMacedonia, FYRMadagascarMalawiMalaysiaMaldivesMaliMaltaMarshall IslandsMauritaniaMauritiusMexicoMicronesia, Fed. Sts.Middle East & North AfricaMiddle East & North Africa (excluding high income)Middle East & North Africa (IDA & IBRD countries)Middle incomeMoldovaMongoliaMontenegroMoroccoMozambiqueMyanmarNamibiaNepalNetherlandsNew CaledoniaNew ZealandNicaraguaNigerNigeriaNorth AmericaNorwayOECD membersOmanOther small statesPacific island small statesPakistanPalauPanamaPapua New GuineaParaguayPeruPhilippinesPolandPortugalPost-demographic dividendPre-demographic dividendQatarRomaniaRussian FederationRwandaSamoaSao Tome and PrincipeSaudi ArabiaSenegalSerbiaSeychellesSierra LeoneSingaporeSint Maarten (Dutch part)Slovak RepublicSloveniaSmall statesSolomon IslandsSouth AfricaSouth AsiaSouth Asia (IDA & IBRD)South SudanSpainSri LankaSt. Kitts and NevisSt. LuciaSt. Vincent and the GrenadinesSub-Saharan Africa Sub-Saharan Africa (excluding high income)Sub-Saharan Africa (IDA & IBRD countries)SudanSurinameSwazilandSwedenSwitzerlandSyrian Arab RepublicTajikistanTanzaniaThailandTimor-LesteTogoTongaTrinidad and TobagoTunisiaTurkeyTuvaluUgandaUkraineUnited KingdomUnited StatesUpper middle incomeUruguayVanuatuVenezuela, RBWest Bank and GazaWorldYemen, Rep.ZambiaZimbabwe Linha do tempo:
Nesta escala de tempo está apresentado um gráfico de 1979 ano até 2014 ano St. Vincent and the Grenadines. Dados de 1978 ano ausente. O número de observações reais por data: 36.
Fonte (nome):
Indicadores de desenvolvimento mundial
Fonte (organização):
International Monetary Fund, Balance of Payments Statistics Yearbook and data files.
Categorias:
Economy & Growth, Private Sector, Trade
Foi atualizado:
23 abr 2017 ano
Indicadores de alterações dos valores ao longo dos anos
Mínimo:
3.98
1 jan 1982 ano
Máximo:
12.779
1 jan 1992 ano
Na data de observação
Valor
Mudança absoluta
A alteração em relação ao valor anterior
1 jan 1979 ano
5.885
+5.885
0.0%
1 jan 1980 ano
4.29
-1.595
-27.1%
1 jan 1981 ano
4.556
+0.266
6.2%
1 jan 1982 ano
3.98
-0.576
-12.65%
1 jan 1983 ano
4.338
+0.358
8.98%
1 jan 1984 ano
4.62
+0.282
6.51%
1 jan 1985 ano
4.438
-0.182
-3.94%
1 jan 1986 ano
4.419
-0.019
-0.42%
1 jan 1987 ano
7.455
+3.036
68.69%
1 jan 1988 ano
7.63
+0.175
2.35%
1 jan 1989 ano
8.868
+1.238
16.22%
1 jan 1990 ano
7.777
-1.091
-12.3%
1 jan 1991 ano
8.777
+1.0
12.86%
1 jan 1992 ano
12.779
+4.002
45.6%
1 jan 1993 ano
6.71
-6.069
-47.49%
1 jan 1994 ano
8.729
+2.019
30.08%
1 jan 1995 ano
5.382
-3.346
-38.34%
1 jan 1996 ano
6.824
+1.442
26.78%
1 jan 1997 ano
7.112
+0.289
4.23%
1 jan 1998 ano
5.706
-1.406
-19.77%
1 jan 1999 ano
6.24
+0.534
9.37%
1 jan 2000 ano
8.17
+1.93
30.93%
1 jan 2001 ano
8.039
-0.131
-1.61%
1 jan 2002 ano
9.028
+0.989
12.31%
1 jan 2003 ano
10.147
+1.118
12.39%
1 jan 2004 ano
9.993
-0.154
-1.52%
1 jan 2005 ano
9.403
-0.59
-5.9%
1 jan 2006 ano
10.074
+0.671
7.14%
1 jan 2007 ano
10.016
-0.059
-0.58%
1 jan 2008 ano
9.442
-0.573
-5.72%
1 jan 2009 ano
11.285
+1.842
19.51%
1 jan 2010 ano
10.354
-0.931
-8.25%
1 jan 2011 ano
11.169
+0.816
7.88%
1 jan 2012 ano
11.675
+0.506
4.53%
1 jan 2013 ano
11.955
+0.28
2.4%
1 jan 2014 ano
12.015
+0.06
0.5%
Classificação de países por estatísticas atuais por anos


Comentários: